
Calendars three days ahead were fuller than in September 2025
Key takeaways
- According to Zillow, the typical home value rose over the past year in 261 markets and fell in 195 markets, with 7 markets unchanged.
- Gross yield, booking revenue over October 2025 to September 2026 divided by the typical home value and before any costs, was 9.1% in the typical market and reached 38.1% in Detroit, MI.
- 201 markets of 480 markets had their busiest month of the past 12 months in July, and calendars in the typical market were 55% full in September 2026 against 57% in an average month.
- Calendars three days ahead were fuller in September 2026 than in September 2025, at 55% against 50%, higher in 394 markets, lower in 78 markets and unchanged in 23 markets.
Where September sits in the market’s own year
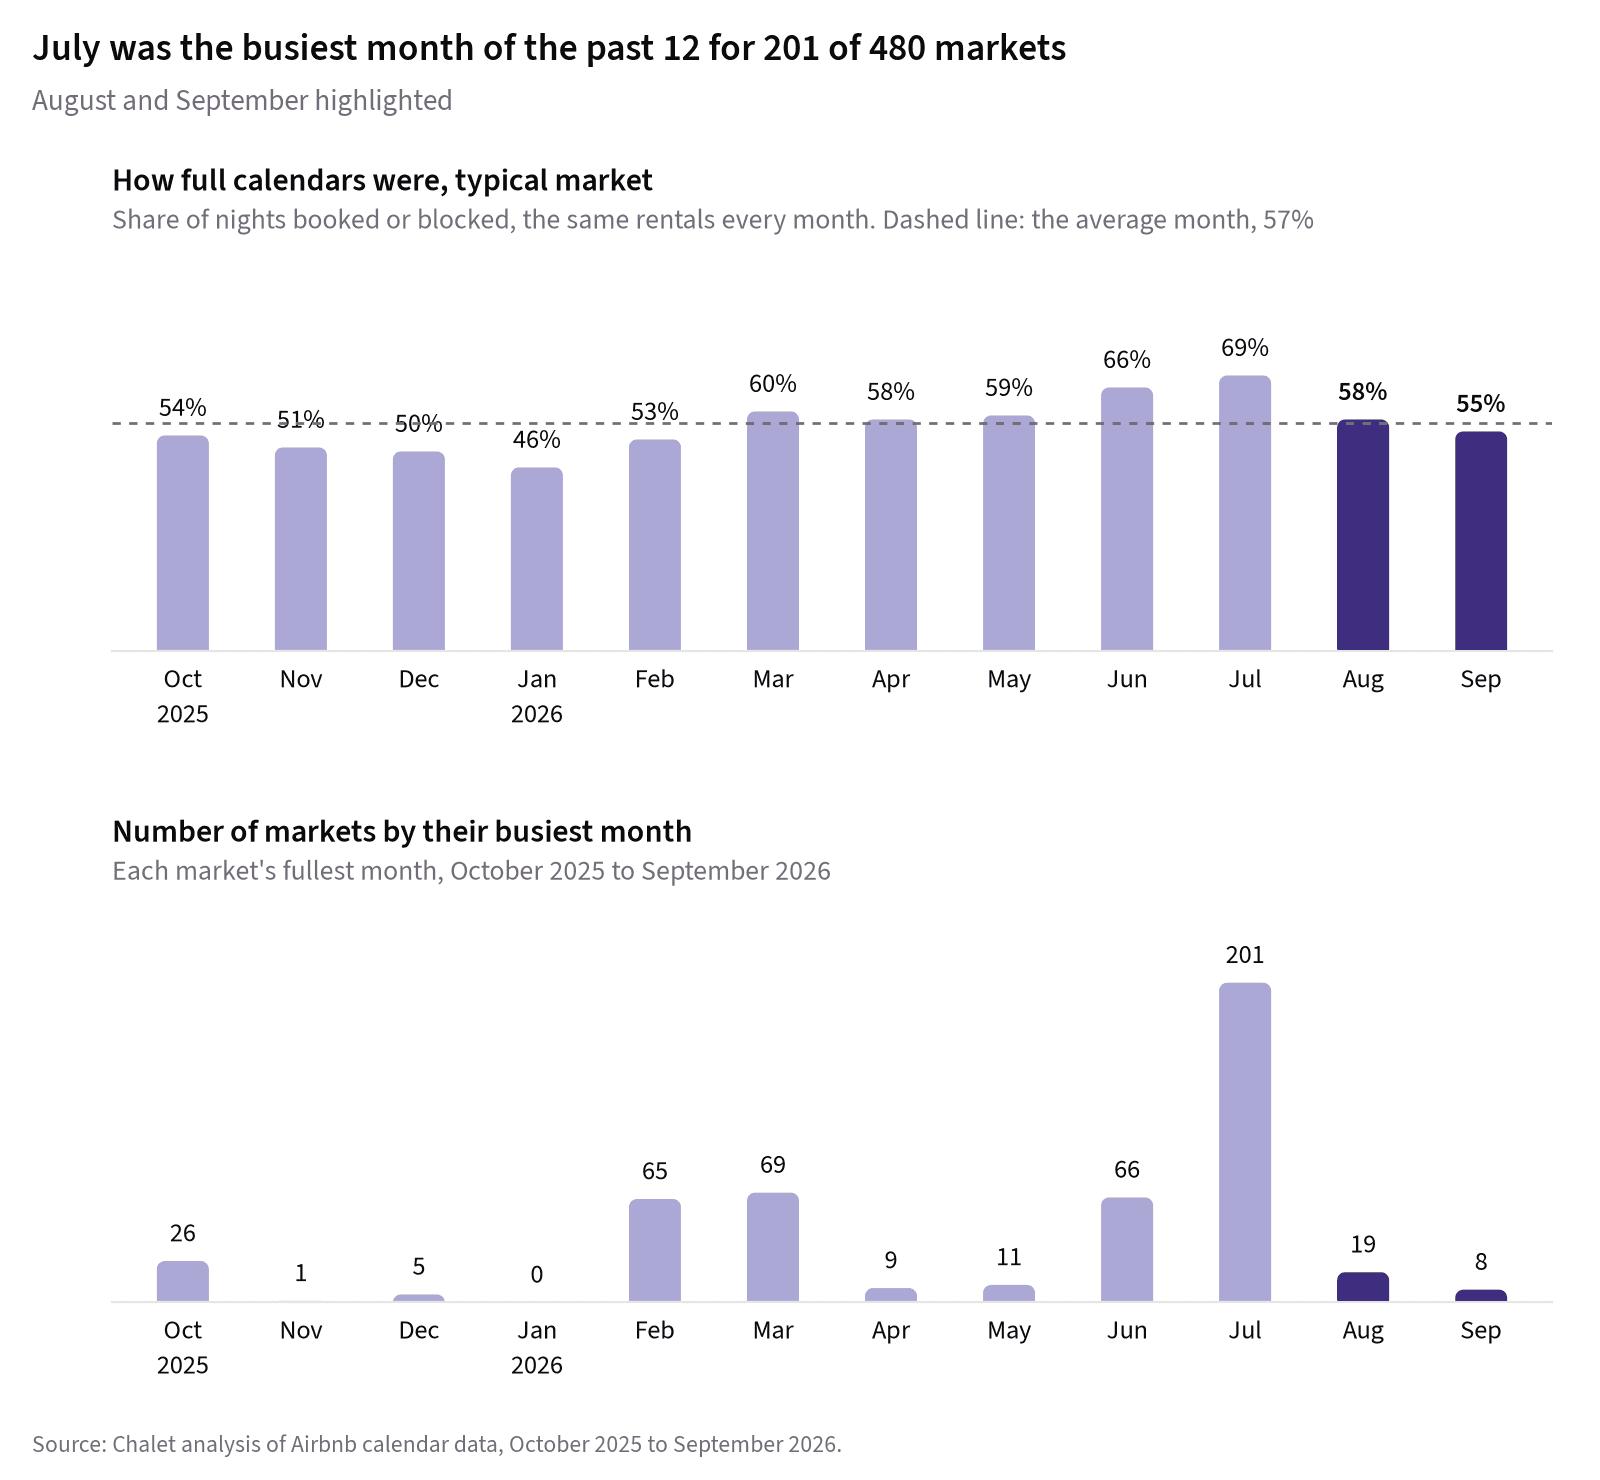
On the same rentals, calendars in the typical market were 58% full in August 2026 and 55% full in September 2026, against 57% in an average month since October 2025. How full calendars were counts nights booked by guests and nights blocked by owners, so it is not the same as nights booked.
For most markets the busiest month fell in summer. 201 markets of 480 markets had their busiest month of the past 12 months in July, 66 markets in June and 19 markets in August. Earlier in the window, 69 markets peaked in March and 65 markets in February.
Measured against each market’s own average month, September was mixed. 190 markets were busier than their average month, 251 markets were quieter and 29 markets were about average. 10 markets had their busiest month of the window in September.

Calendars three days ahead were fuller in September than in September 2025
The one comparison across years that holds up this month is how full calendars were three days before each night, on the same rentals in both years. In August, that share was 58% in August 2025 and 57% in August 2026, across 494 markets and 362,664 rentals. The typical market held about steady, and the counts were close: the share was lower in 242 markets, higher in 205 markets and unchanged in 47 markets.
In September, the picture was clearer. The share of nights booked or blocked three days ahead was 50% in September 2025 and 55% in September 2026, across 495 markets and 459,000 rentals. The typical market rose 4 points, with the share higher in 394 markets, lower in 78 markets and unchanged in 23 markets.
One calendar fact belongs next to those figures: Labor Day weekend fell in August in 2025 and in September in 2026. The data does not say what drove the change. This measure also leaves out bookings made in the last two days before a stay, and it includes nights owners blocked for themselves.

Where calendars moved most against September 2025
Huntsville, AL had the largest rise. The share of nights booked or blocked three days ahead rose from 40% to 69%. In Visalia, CA, the share rose from 43% to 63%, and in Auburn, AL it rose from 38% to 58%.
Three more markets moved almost as far. Meridian, ID went from 60% to 79%. McAllen, TX went from 34% to 53%. Jackson, MS went from 51% to 69%.
The falls were smaller but real. Clarksville, TN had the largest fall, from 69% to 53%. In Abilene, TX, the share went from 82% to 69%. In Port St Lucie, FL, it went from 56% to 46%.

Large markets and states, side by side
Among the markets with many rentals compared, most were fuller three days ahead in September 2026 than in September 2025. In Chicago, IL, the share rose from 64% to 71% across 4,573 rentals. In the market of Panama City Beach, FL, it rose from 45% to 54%. In Kissimmee, FL, with 11,418 rentals compared, the share rose from 42% to 46%.
A few large markets went the other way. Las Vegas, NV went from 51% to 48%, and Houston, TX went from 50% to 47%. In Seattle, WA, the share held at 70%.
By state, with all of a state’s markets combined, Idaho was at the top: the share rose from 64% to 74% across 7 markets. In Pennsylvania, the share rose from 43% to 53%. In Alabama, the share rose from 50% to 59%. At the bottom, Puerto Rico went from 38% to 35%, with Nevada and Hawaii also slightly emptier.
The 20 largest markets
| Market | September 2025 | September 2026 | Change |
|---|---|---|---|
| Kissimmee, FL | 42% | 46% | +4 points |
| Las Vegas, NV | 51% | 48% | −3 points |
| San Diego, CA | 61% | 66% | +5 points |
| Myrtle Beach, SC | 51% | 56% | +5 points |
| Austin, TX | 58% | 63% | +5 points |
| Miami, FL | 49% | 48% | −1 point |
| Los Angeles, CA | 58% | 59% | +1 point |
| Sevierville, TN | 50% | 55% | +5 points |
| Nashville, TN | 55% | 59% | +4 points |
| Panama City Beach, FL | 45% | 54% | +9 points |
| Houston, TX | 50% | 47% | −3 points |
| New York, NY | 74% | 78% | +4 points |
| Atlanta, GA | 50% | 52% | +2 points |
| Orlando, FL | 51% | 54% | +3 points |
| Seattle, WA | 70% | 70% | no change |
| Brooklyn, NY | 70% | 73% | +3 points |
| Davenport, FL | 41% | 42% | +1 point |
| Chicago, IL | 64% | 71% | +7 points |
| Honolulu, HI | 65% | 64% | −1 point |
| North Myrtle Beach, SC | 52% | 59% | +7 points |
By state
| State | September 2025 | September 2026 | Change |
|---|---|---|---|
| Idaho | 64% | 74% | +10 points |
| Pennsylvania | 43% | 53% | +10 points |
| Alabama | 50% | 59% | +9 points |
| Mississippi | 41% | 49% | +8 points |
| Virginia | 58% | 66% | +8 points |
| California | 49% | 56% | +7 points |
| Maryland | 46% | 53% | +7 points |
| New Jersey | 53% | 60% | +7 points |
| New York | 65% | 72% | +7 points |
| Oklahoma | 39% | 46% | +7 points |
| Colorado | 53% | 59% | +6 points |
| Indiana | 52% | 58% | +6 points |
| South Carolina | 53% | 59% | +6 points |
| Wisconsin | 54% | 60% | +6 points |
| Alaska | 61% | 66% | +5 points |
| North Carolina | 53% | 58% | +5 points |
| Texas | 45% | 50% | +5 points |
| Vermont | 49% | 54% | +5 points |
| Arkansas | 43% | 47% | +4 points |
| Florida | 43% | 47% | +4 points |
| Louisiana | 39% | 43% | +4 points |
| Michigan | 53% | 57% | +4 points |
| Ohio | 58% | 62% | +4 points |
| Tennessee | 53% | 57% | +4 points |
| Arizona | 50% | 53% | +3 points |
| Georgia | 50% | 53% | +3 points |
| Maine | 73% | 76% | +3 points |
| Montana | 60% | 63% | +3 points |
| New Hampshire | 45% | 48% | +3 points |
| New Mexico | 57% | 60% | +3 points |
| Oregon | 63% | 66% | +3 points |
| Massachusetts | 69% | 71% | +2 points |
| Minnesota | 67% | 69% | +2 points |
| Utah | 50% | 52% | +2 points |
| Washington | 67% | 68% | +1 point |
| Missouri | 52% | 52% | no change |
| Rhode Island | 63% | 63% | no change |
| Hawaii | 60% | 59% | −1 point |
| Nevada | 51% | 49% | −2 points |
| Puerto Rico | 38% | 35% | −3 points |
Share of nights booked or blocked three days before each night, September 2025 and September 2026, same rentals in both years. States combine all their markets in this report.
Home values barely moved over the past year in the typical market
Home values here are Zillow’s figures, seasonally adjusted, so a one-month move is a real move rather than a seasonal one. Across 463 markets, the typical home value rose 0.4% over the past year. Values rose in 261 markets, fell in 195 markets and were unchanged in 7 markets.
Over the past month the balance tilted up. The typical home value rose 0.1% over the past month, with values rising in 296 markets, falling in 110 markets and unchanged in 57 markets.
The spread between markets matters more than the national middle. The biggest rise over the past year was in San Francisco, CA, where the typical home value rose 13.6% over the past year, from $1,253,695 to $1,424,767. In Newport Beach, CA, it rose 10.7% over the past year, from $3,340,467 to $3,697,219. The biggest drop was in Carlsbad, CA, where it fell 15.9% over the past year, from $1,893,490 to $1,593,241.

The highest gross yields sit in low-priced markets
Gross yield is a market’s booking revenue over October 2025 to September 2026 divided by its typical home value, before any costs. It sets booking revenue against home values and says nothing about what an owner keeps. Across 465 markets with a rank, it was 9.1% in the typical market.
Detroit, MI ranked No. 1 at 38.1%, on booking revenue of $29,403 against a typical home value of $77,199. Michigan City, IN came next at 36.7%, and Jackson, MS at 32.3%.
Read those numbers with care. Where typical home values are low, the homes used as rentals often cost more than the typical home, so the yield can overstate what a purchase would actually bring in.

Markets worth a closer look
Pocono Lake, PA is here for a high gross yield in a market where home values fell over the past year. Its gross yield of 20.1% ranks No. 18, and the typical home value fell 0.8% over the past year, from $283,806 to $281,460. Its busiest month of the window was July, at 77% full.
Gatlinburg, TN is here for a high gross yield in a market whose busiest month of the past 12 months fell between October and January. Calendars there were 78% full in October, the busiest month of the window, and the typical home value fell 2.6% over the past year, from $417,553 to $406,899.
McAllen, TX appears for this reason: calendars three days ahead were much fuller than a year earlier. Its gross yield of 11.0% ranks No. 154, the typical home value rose 0.5% over the past year, from $227,901 to $229,066, and September was busier than its average month.
Michigan City, IN is here for its gross yield of 36.7%, No. 2 nationally, and its typical home value of $195,500 is part of why that figure is so high. The typical home value rose 4.4% over the past year, from $187,211 to $195,500. Calendars were 91% full in July, and September was busier than its average month. The scorecards below hold the rest of the figures, and none of this is a recommendation to buy.
Pocono Lake, PA
Why we picked it: a high gross yield in a market where home values fell over the past year.
| Typical home value, August 2026 | $281,460 |
|---|---|
| Change over the past year | −0.8% |
| Gross yield (national rank) | 20.1% (No. 18 of 465 markets) |
| Booking revenue, October 2025 to September 2026 | $56,551 |
| Busiest month since October 2025 | July (77% of nights filled) |
| September: how full calendars were | 51%, quieter than its average month |
| How full calendars were three days ahead, September 2025 → September 2026 | 30% → 36% |
Gatlinburg, TN
Why we picked it: a high gross yield in a market whose busiest month of the past 12 months fell between October and January.
| Typical home value, August 2026 | $406,899 |
|---|---|
| Change over the past year | −2.6% |
| Gross yield (national rank) | 14.0% (No. 66 of 465 markets) |
| Booking revenue, October 2025 to September 2026 | $57,050 |
| Busiest month since October 2025 | October (78% of nights filled) |
| September: how full calendars were | 59%, quieter than its average month |
| How full calendars were three days ahead, September 2025 → September 2026 | 52% → 56% |
McAllen, TX
Why we picked it: calendars three days ahead were much fuller than a year earlier.
| Typical home value, August 2026 | $229,066 |
|---|---|
| Change over the past year | +0.5% |
| Gross yield (national rank) | 11.0% (No. 154 of 465 markets) |
| Booking revenue, October 2025 to September 2026 | $25,132 |
| Busiest month since October 2025 | July (63% of nights filled) |
| September: how full calendars were | 50%, busier than its average month |
| How full calendars were three days ahead, September 2025 → September 2026 | 34% → 53% |
Michigan City, IN
Why we picked it: the highest gross yield among the markets in this report.
| Typical home value, August 2026 | $195,500 |
|---|---|
| Change over the past year | +4.4% |
| Gross yield (national rank) | 36.7% (No. 2 of 465 markets) |
| Booking revenue, October 2025 to September 2026 | $71,787 |
| Busiest month since October 2025 | July (91% of nights filled) |
| September: how full calendars were | 65%, busier than its average month |
| How full calendars were three days ahead, September 2025 → September 2026 | 45% → 53% |
Typical home values from Zillow, August 2026; booking revenue and gross yield over October 2025 to September 2026, as on each market's Chalet analytics page; calendar fill on the same rentals, October 2025 to September 2026.
Frequently asked questions
What does “how full calendars were three days ahead” mean?
It is the share of nights that were booked by guests or blocked by owners three days before each night, on the same rentals in both years. It leaves out bookings made in the last two days before a stay, and it includes nights owners blocked for themselves, so it is not the same as nights booked.
Were calendars fuller in September than in September 2025?
Yes. The share of nights booked or blocked three days ahead was 50% in September 2025 and 55% in September 2026, across 495 markets. It was higher in 394 markets, lower in 78 markets and unchanged in 23 markets. One calendar fact sits alongside this: Labor Day weekend fell in August in 2025 and in September in 2026.
Was September a busy month for short-term rentals?
For most markets it was past the peak. 201 markets of 480 markets had their busiest month of the past 12 months in July, and calendars in the typical market were 55% full in September 2026 against 57% in an average month. Still, 190 markets were busier than their own average month.
What is gross yield, and what was it this month?
Gross yield is booking revenue over October 2025 to September 2026 divided by the typical home value, before any costs. It was 9.1% in the typical market and highest in Detroit, MI at 38.1%. It measures booking revenue against home values, and where typical home values are low the figure can overstate what a purchase would bring in.
Are home values rising where people buy rentals?
It depends on the market. According to Zillow, the typical home value rose 0.4% over the past year. Values rose in 261 markets, fell in 195 markets and were unchanged in 7 markets.
Previous reports
Every market’s figures, updated monthly: Chalet market analytics.
How we measured this
The typical market is the middle market when all markets are lined up from lowest to highest. Rental figures come from the calendars of Airbnb listings we track in each market.
This report uses data processed after the middle of the following month, once guests’ reviews and late changes for September 2026 have come in. Figures can still be revised slightly as late changes are confirmed.
Typical home values are Zillow’s Home Value Index for each market’s city: the value of a typical, middle-priced home, seasonally adjusted, so a change from one month to the next is not just the time of year. Changes over the past year compare August 2026 with August 2025.
Gross yield is a market’s booking revenue over October 2025 to September 2026 divided by its typical home value, before cleaning fees, platform fees, taxes and the owner’s costs. It is the figure shown on each market’s Chalet analytics page, and the rank is among the 465 markets with a yield. It compares rental revenue with the city’s typical home, not with the homes used as rentals, which often cost more.
To compare with last year we use how full calendars were three days before each night: the share of nights already booked by guests or blocked by owners when we checked the calendar three days ahead, for the same rentals in both years. It leaves out bookings made in the last two days, so it is lower than the share of nights eventually booked. We read every night the same number of days ahead because in September 2025 Airbnb calendars changed how they show the next night or two, which would otherwise make this year look emptier than it was. Nights booked, nightly prices and booking revenue cannot yet be compared with last year: how we detect bookings made far ahead, and where prices come from, both changed in late 2025.
How full calendars were is the share of calendar nights that were booked by guests or blocked by owners, for the same rentals in every month from October 2025 to September 2026. A market’s busiest month is its fullest month in that window. We use calendar nights here because they show each market’s seasons more completely than the bookings we can detect from calendar changes, which miss many stays booked far ahead.