Your Airbnb rental's profitability comes down to one critical metric: occupancy rate. It tells you what percentage of available nights actually get booked, and it varies wildly depending on where you invest.
The national average for short-term rentals (STRs) hovers around the mid-50% range. But that single number hides enormous variation. Some California cities consistently hit 80%+ occupancy while certain seasonal beach towns struggle to break 20% over a full year.
If you're researching your first investment property or trying to figure out why your existing rental underperforms, you need city-specific data. This guide breaks down average Airbnb occupancy rates by city, explains what drives those numbers up or down, and shows you how to use this information to make smarter investment decisions.
What Is Airbnb Occupancy Rate and Why Does It Matter?
Occupancy rate measures the share of time your rental is booked compared to when it's available. The calculation is straightforward:
Occupancy Rate = (Nights Booked / Nights Available) x 100
Say you make your listing available every day in June (30 nights total) and guests book 18 of those nights. Your occupancy rate for June is 60%.
A quick note on "adjusted occupancy": if you block off dates for personal use or maintenance, some platforms don't count those as available nights. The key concept remains the same though. Occupancy reflects how much demand exists for your specific listing.
Why this number matters so much:
Occupancy directly determines your revenue. Every additional booked night equals more income. Combined with your average daily rate (ADR), occupancy essentially gives you RevPAR (revenue per available rental). A property with a low occupancy rate might look great on paper based on nightly rates, but if it sits empty half the year, your actual returns suffer. Understanding how Airbnb income works helps you grasp how these metrics interconnect.
Occupancy also affects your financing options. Lenders evaluating DSCR loans for STR purchases will ask about expected occupancy. Underwriters want to see realistic projections, and markets with historically strong occupancy make for easier loan approvals. Use our free DSCR calculator to see how your numbers stack up.
What Is a Good Airbnb Occupancy Rate?
The honest answer? It depends on your market.
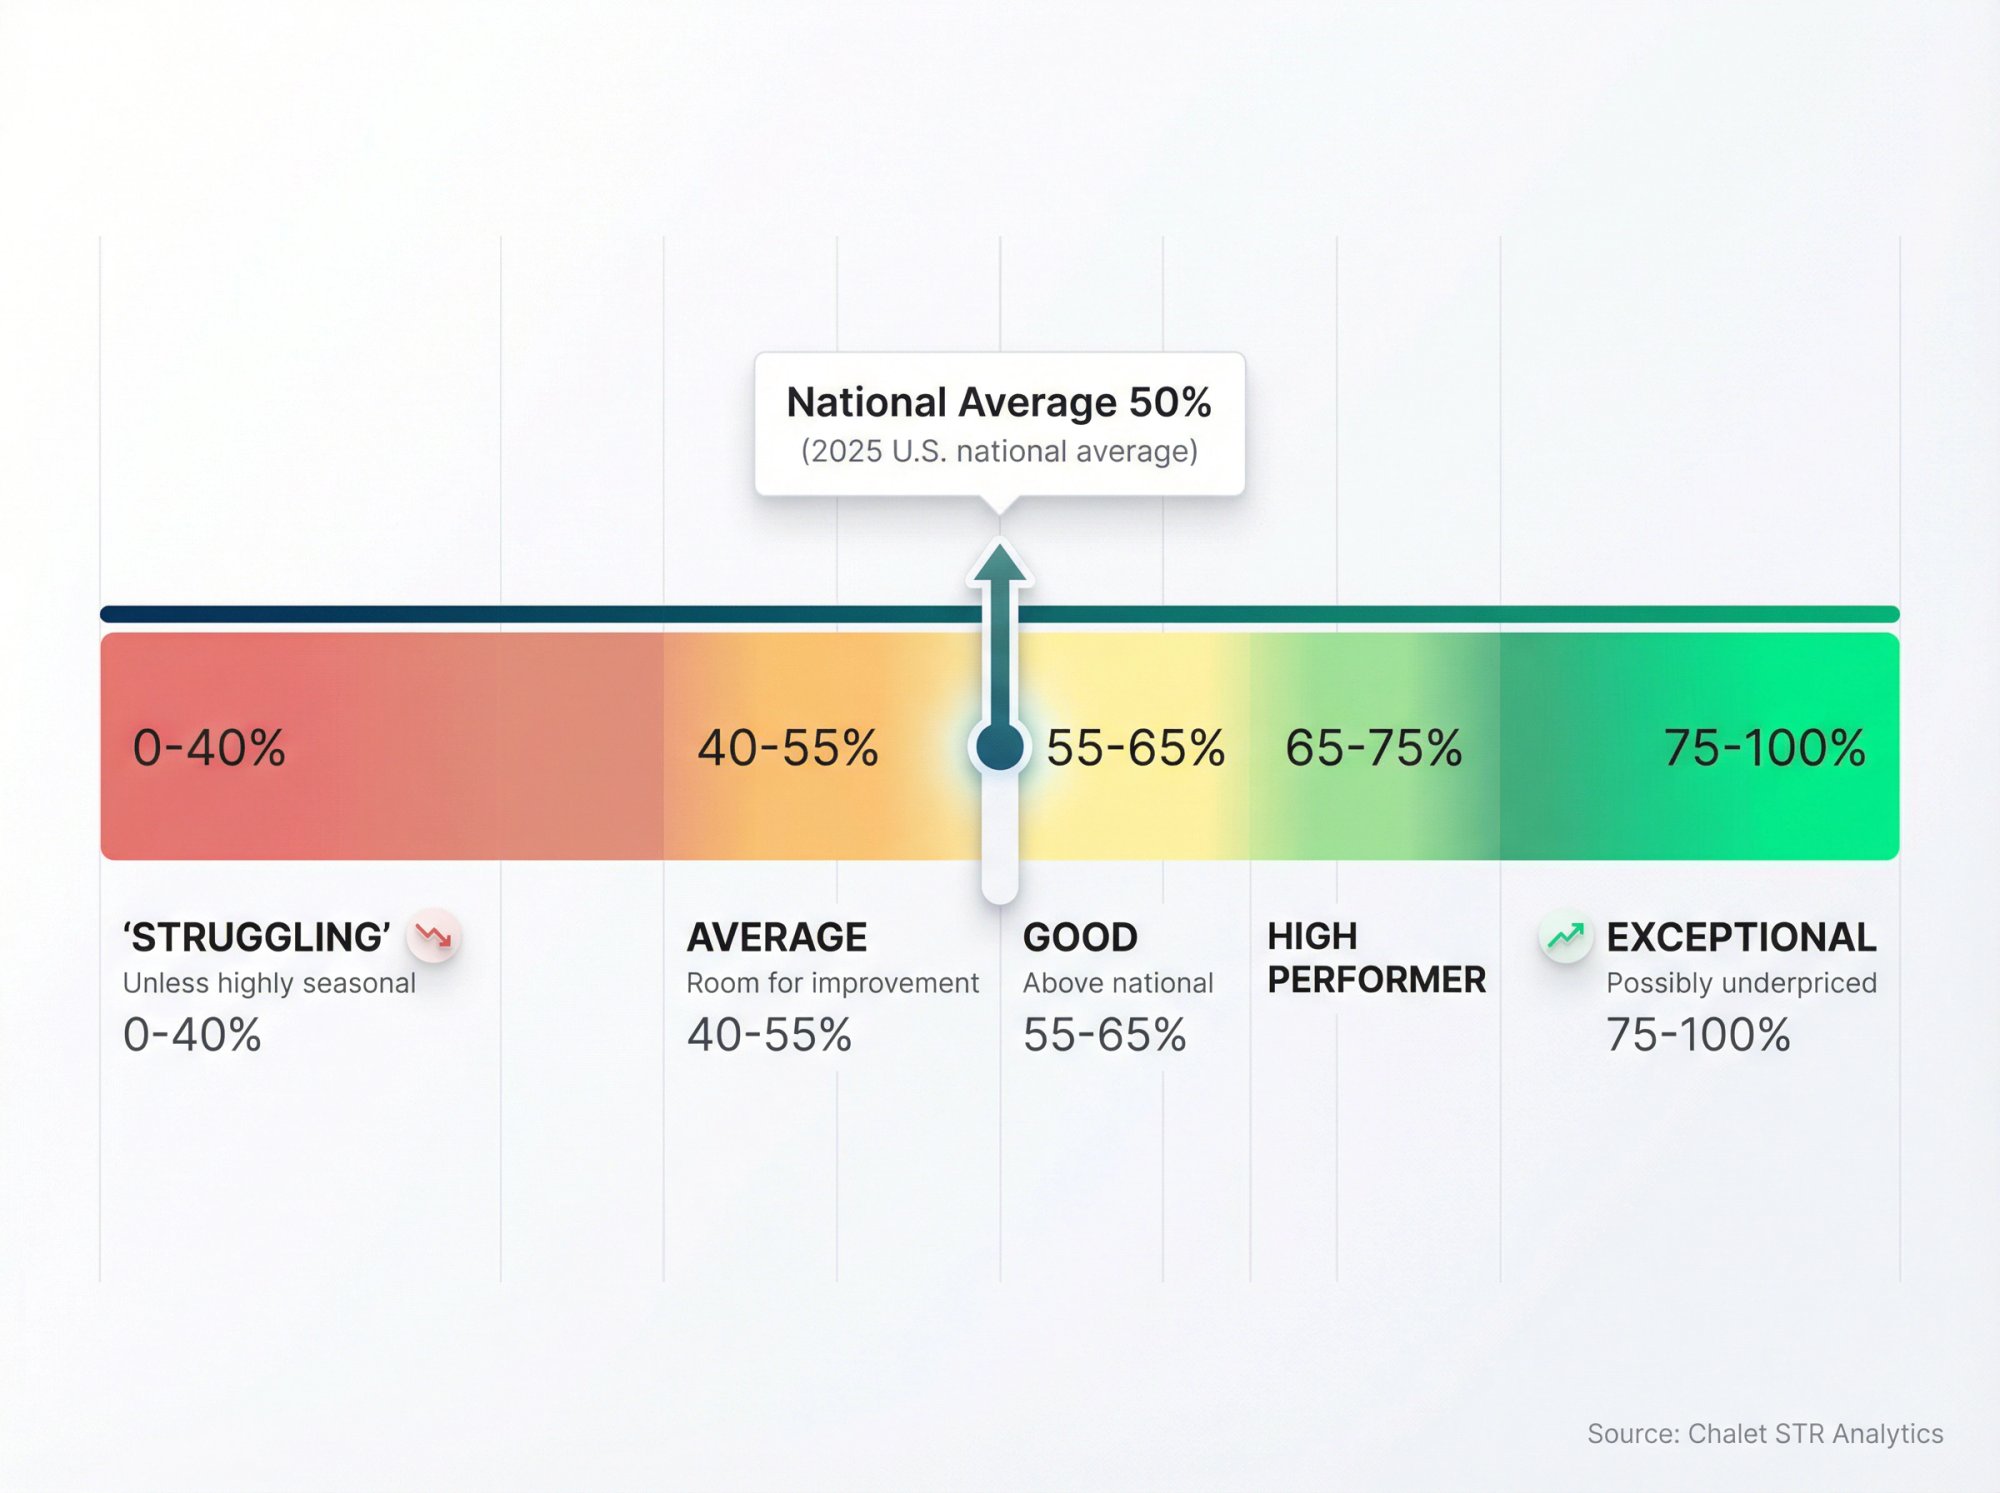
According to 2024-2025 industry data, the average U.S. Airbnb occupancy sits around 50%. That's actually down from approximately 57% the year prior, largely because a flood of new short-term rentals entered the market faster than guest demand grew. This trend is covered extensively in our 2024 short-term rental trends analysis.
Here's a practical framework for evaluating occupancy:
| Occupancy Range | How to Interpret It |
|---|---|
| Below 40% | Struggling, unless it's a highly seasonal market |
| 40-55% | Average or slightly below, room for improvement |
| 55-65% | Good, above the national average |
| 65-75% | High performer |
| Above 75% | Exceptional (often means underpricing or unique location) |
These benchmarks shift based on context. A 40% annual occupancy in a ski town might actually be excellent if you're crushing it during winter months. A 60% rate in a year-round tourist destination might signal you're underperforming compared to competitors.
The real goal isn't hitting some arbitrary percentage. It's beating your specific market's average while maintaining rates high enough to maximize total revenue.
A property running at 100% occupancy often signals a problem. You're probably priced too low. The sweet spot usually involves accepting slightly lower occupancy in exchange for higher nightly rates that boost your overall income. For a deeper dive into what makes Airbnb rentals truly profitable, check out our market-based profitability analysis.
6 Factors That Affect Short-Term Rental Occupancy Rates
Why do occupancy rates swing so dramatically between cities and even between properties in the same neighborhood? Six factors explain most of the variation.
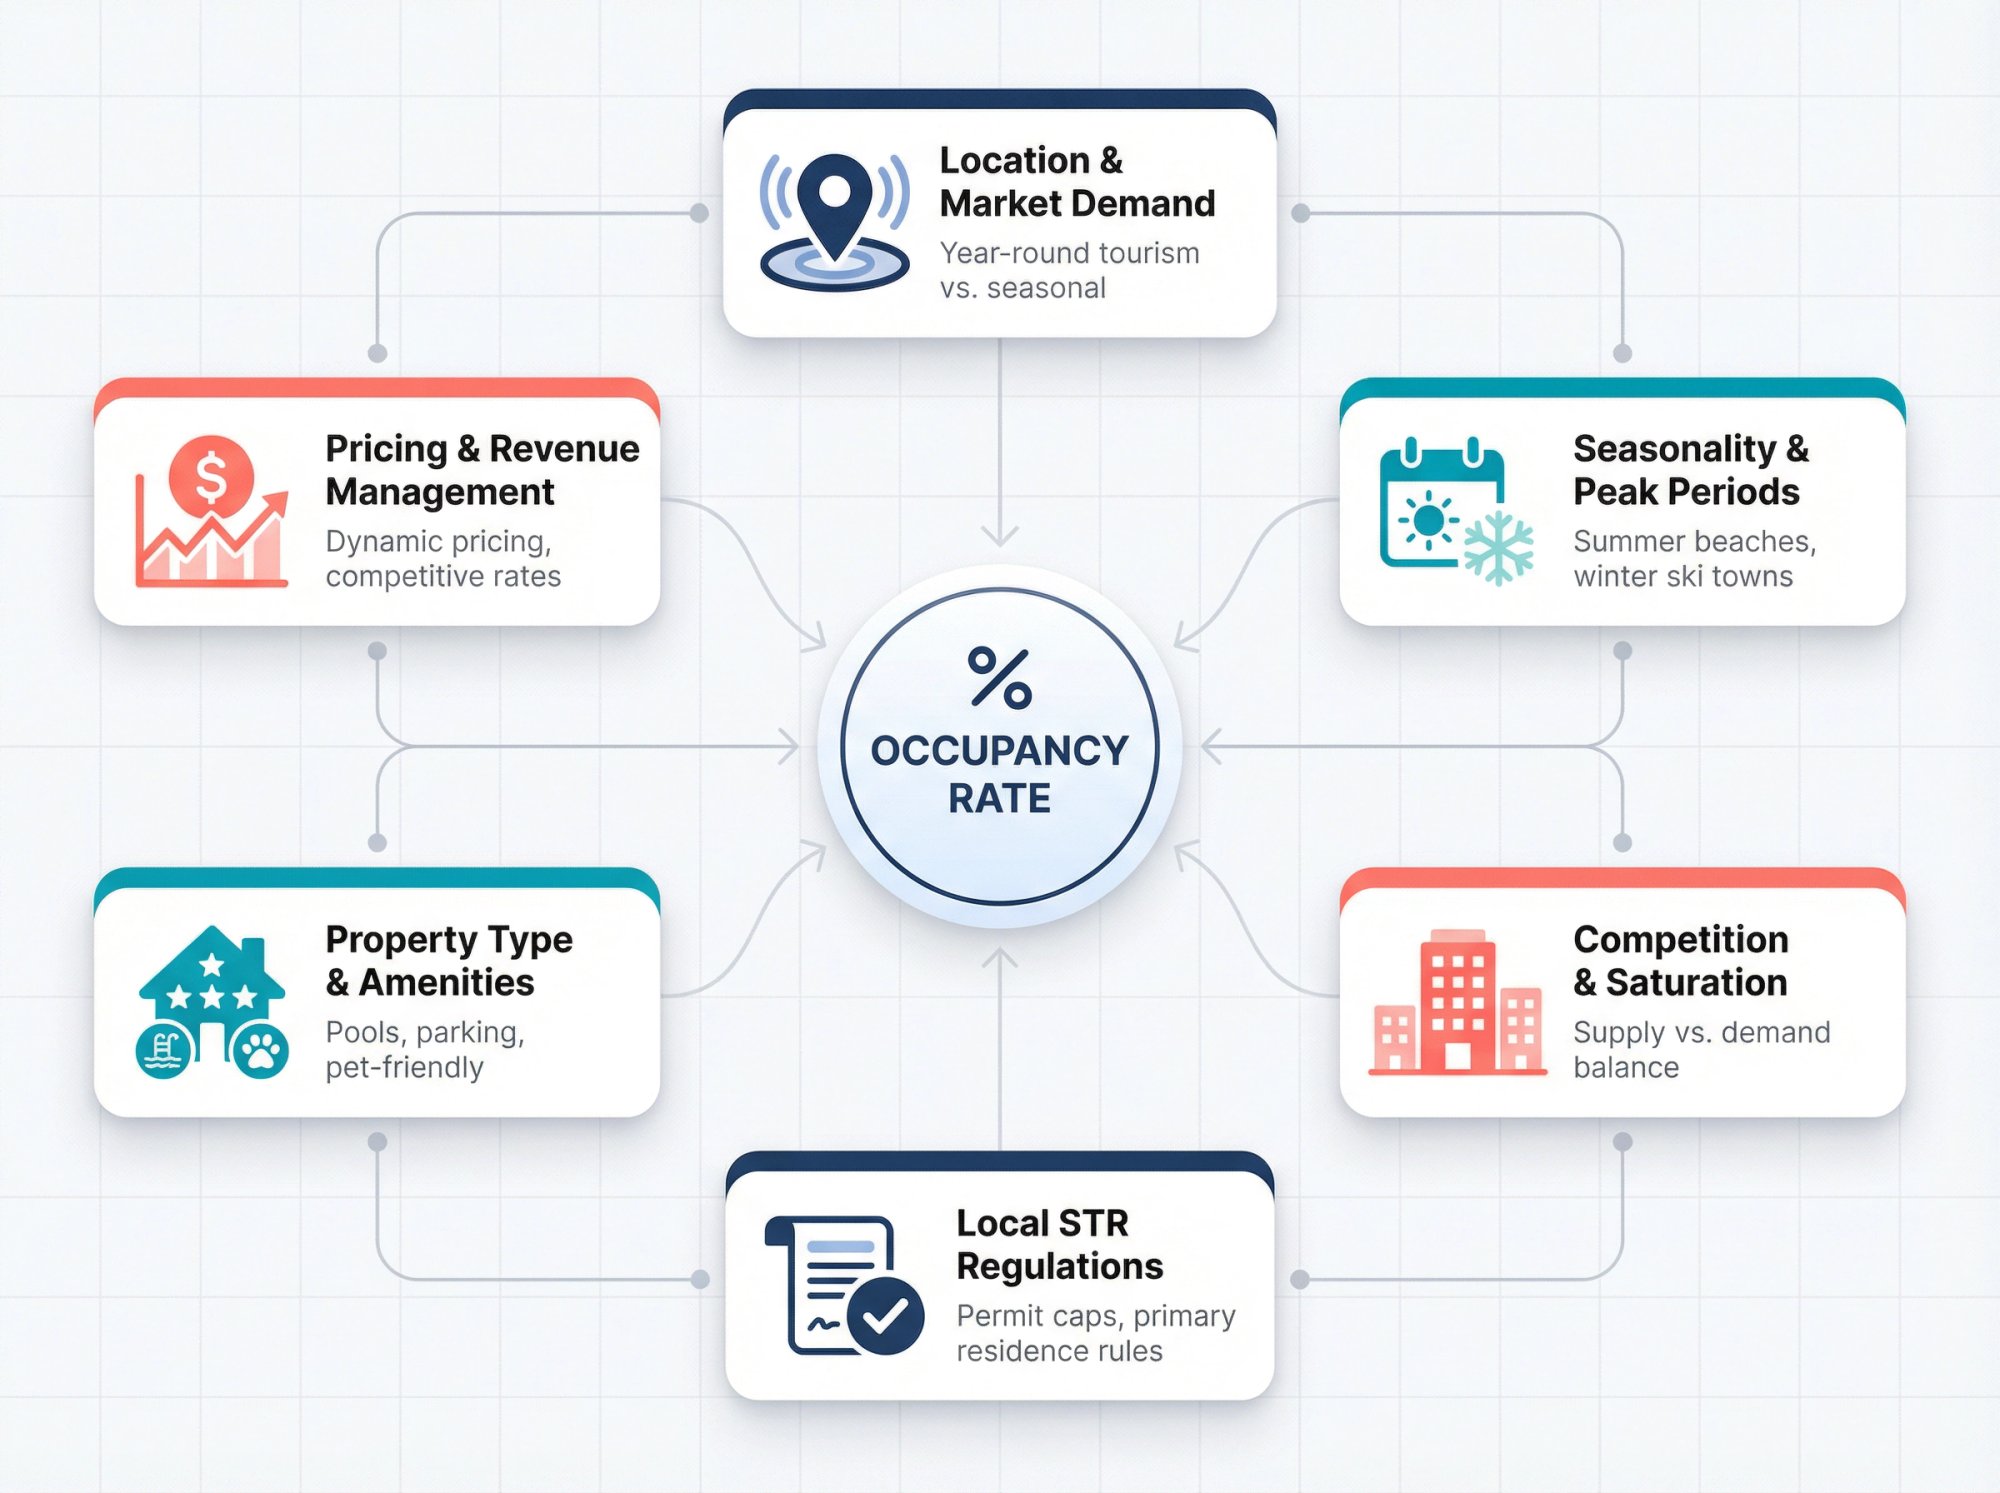
Location and Market Demand
This is the biggest driver. Cities with strong year-round tourism or steady business travel naturally generate more consistent bookings. An STR in Orlando or Honolulu attracts guests throughout the year, while a rental in a small rural town might only see occasional visitors.
Specific neighborhoods matter too, even within cities. A downtown property near convention centers might fill weekday nights with business travelers while a suburban listing depends more heavily on weekend leisure guests. Exploring best places to invest in Orlando short-term rentals can help you identify prime neighborhoods.
Strong travel demand = higher potential occupancy (assuming competition doesn't get out of hand).
Seasonality and Peak Travel Periods
Almost every market has peak seasons and slow periods.
→ Beach destinations fill up in summer, empty out in winter
→ Ski towns boom from December through March, then slow dramatically
→ Urban markets often see dips around holidays or during summer when business travel drops
Highly seasonal markets can show deceiving annual averages. A summer beach rental might hit 95% occupancy in July but sit at 5% in January. The annual average looks mediocre even though the property performs exceptionally during its peak months. Markets like Destin, FL exemplify this seasonal pattern.
Competition and Listing Saturation
Occupancy is fundamentally a supply and demand equation. When a market sees a sudden influx of new Airbnb listings without a corresponding jump in guest demand, average occupancies drop. This happened across many U.S. markets between 2022 and 2024 as short-term rentals exploded in popularity. Our analysis of how STR investors can still win in 2025 explains how to navigate oversaturated markets.
On the flip side, markets where regulations or other barriers limit the number of available rentals often show higher occupancy for the listings that do exist.
How Local STR Regulations Impact Occupancy
STR regulations have massive indirect effects on occupancy. In cities that cap the number of short-term rentals or restrict them to primary residences only, the reduced supply can push occupancy significantly higher for remaining legal listings. Guests still want to visit, but they have fewer options to choose from.
The other side of this: markets where regulations create uncertainty or heavy compliance burdens sometimes see demand soften as hosts switch to long-term rentals. Vancouver's primary-residence rule caused a 62% year-over-year occupancy drop as many listings left the short-term market entirely. Learn how to navigate local regulations and STR licensing before committing to a market.
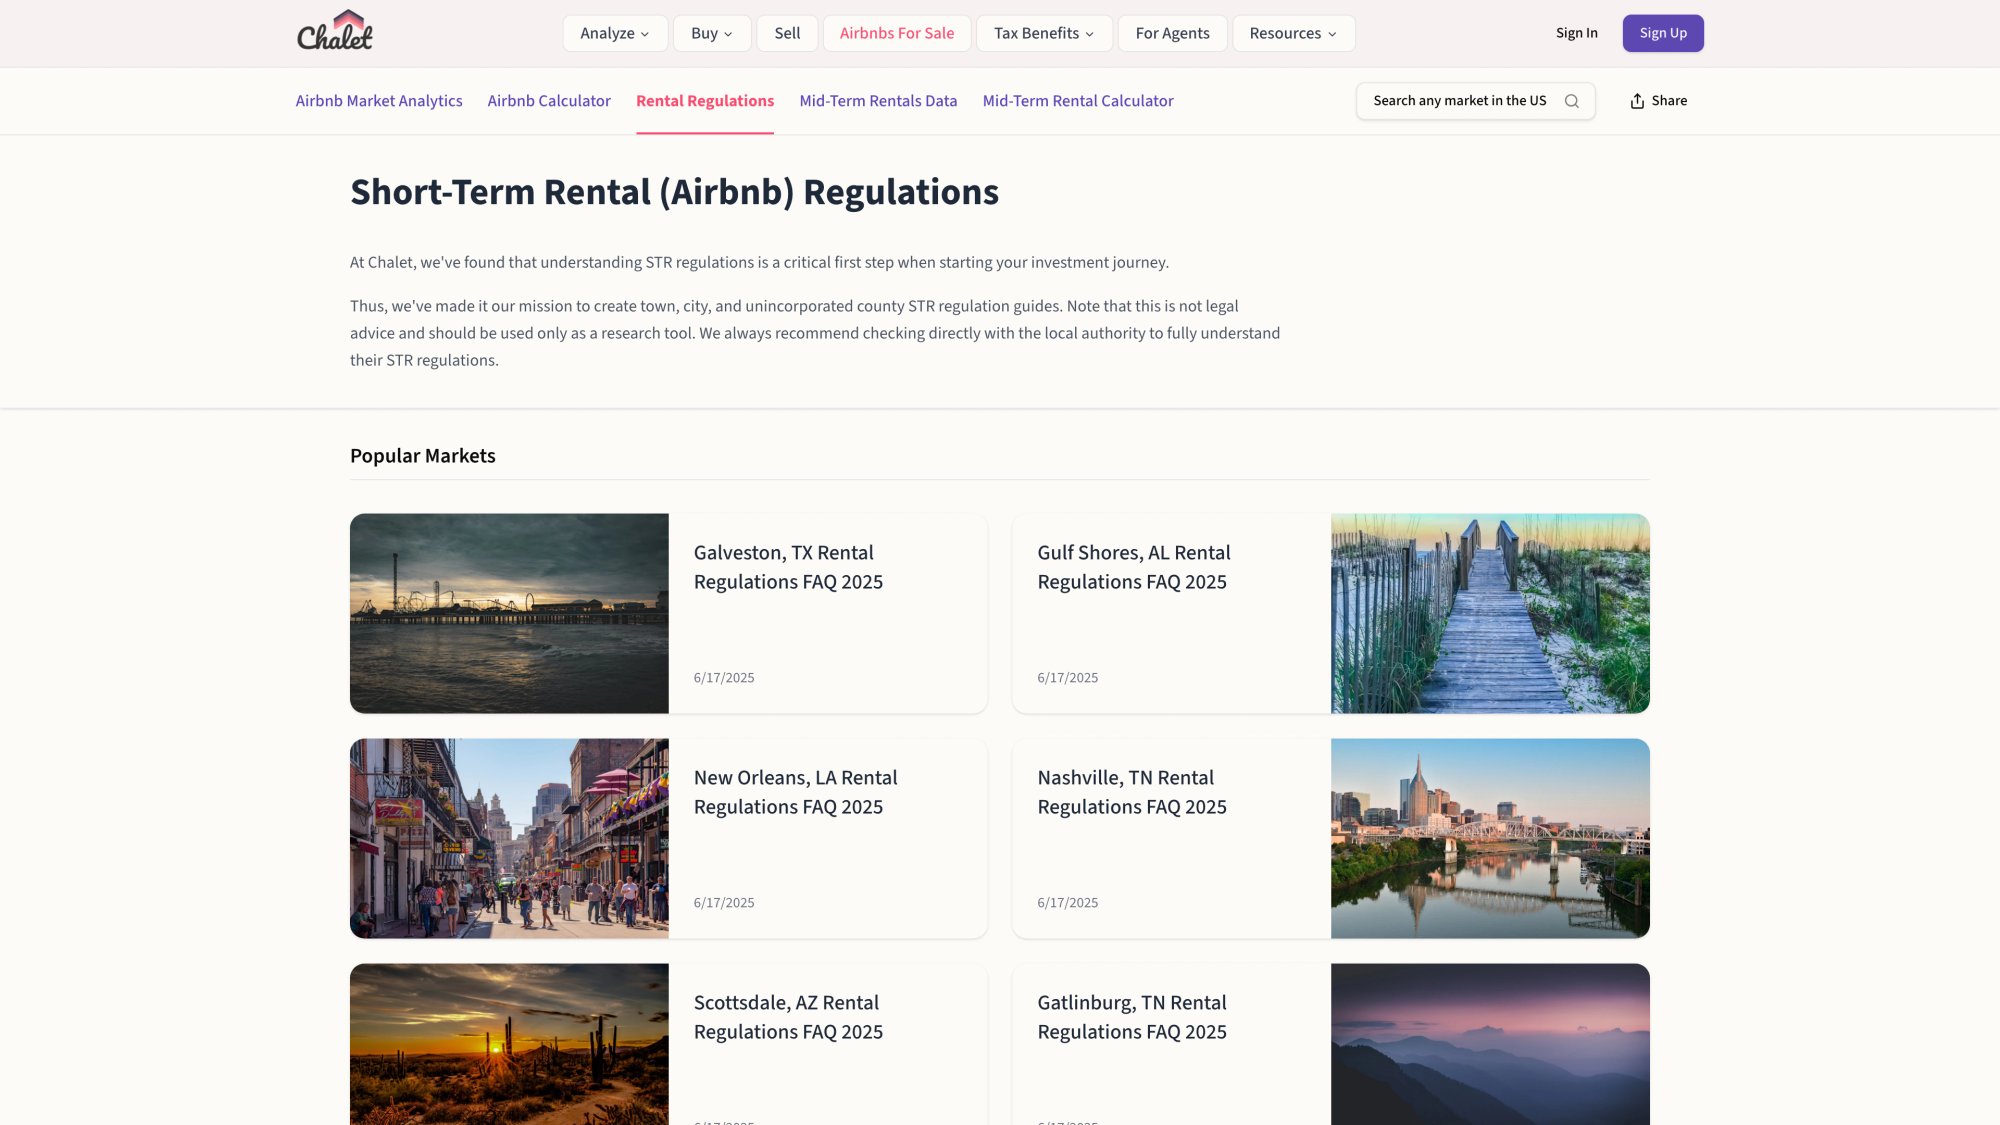
Always research local short-term rental regulations before investing. Chalet's free STR Regulation Library covers rules in markets across the country.
Property Type and Amenities That Boost Bookings
What you offer influences how often you get booked. A unique lakeside cottage or a luxury condo with a pool draws more interest than a generic spare room, even in the same city. Our guide on how to choose the right investment short-term rental property covers this in detail.
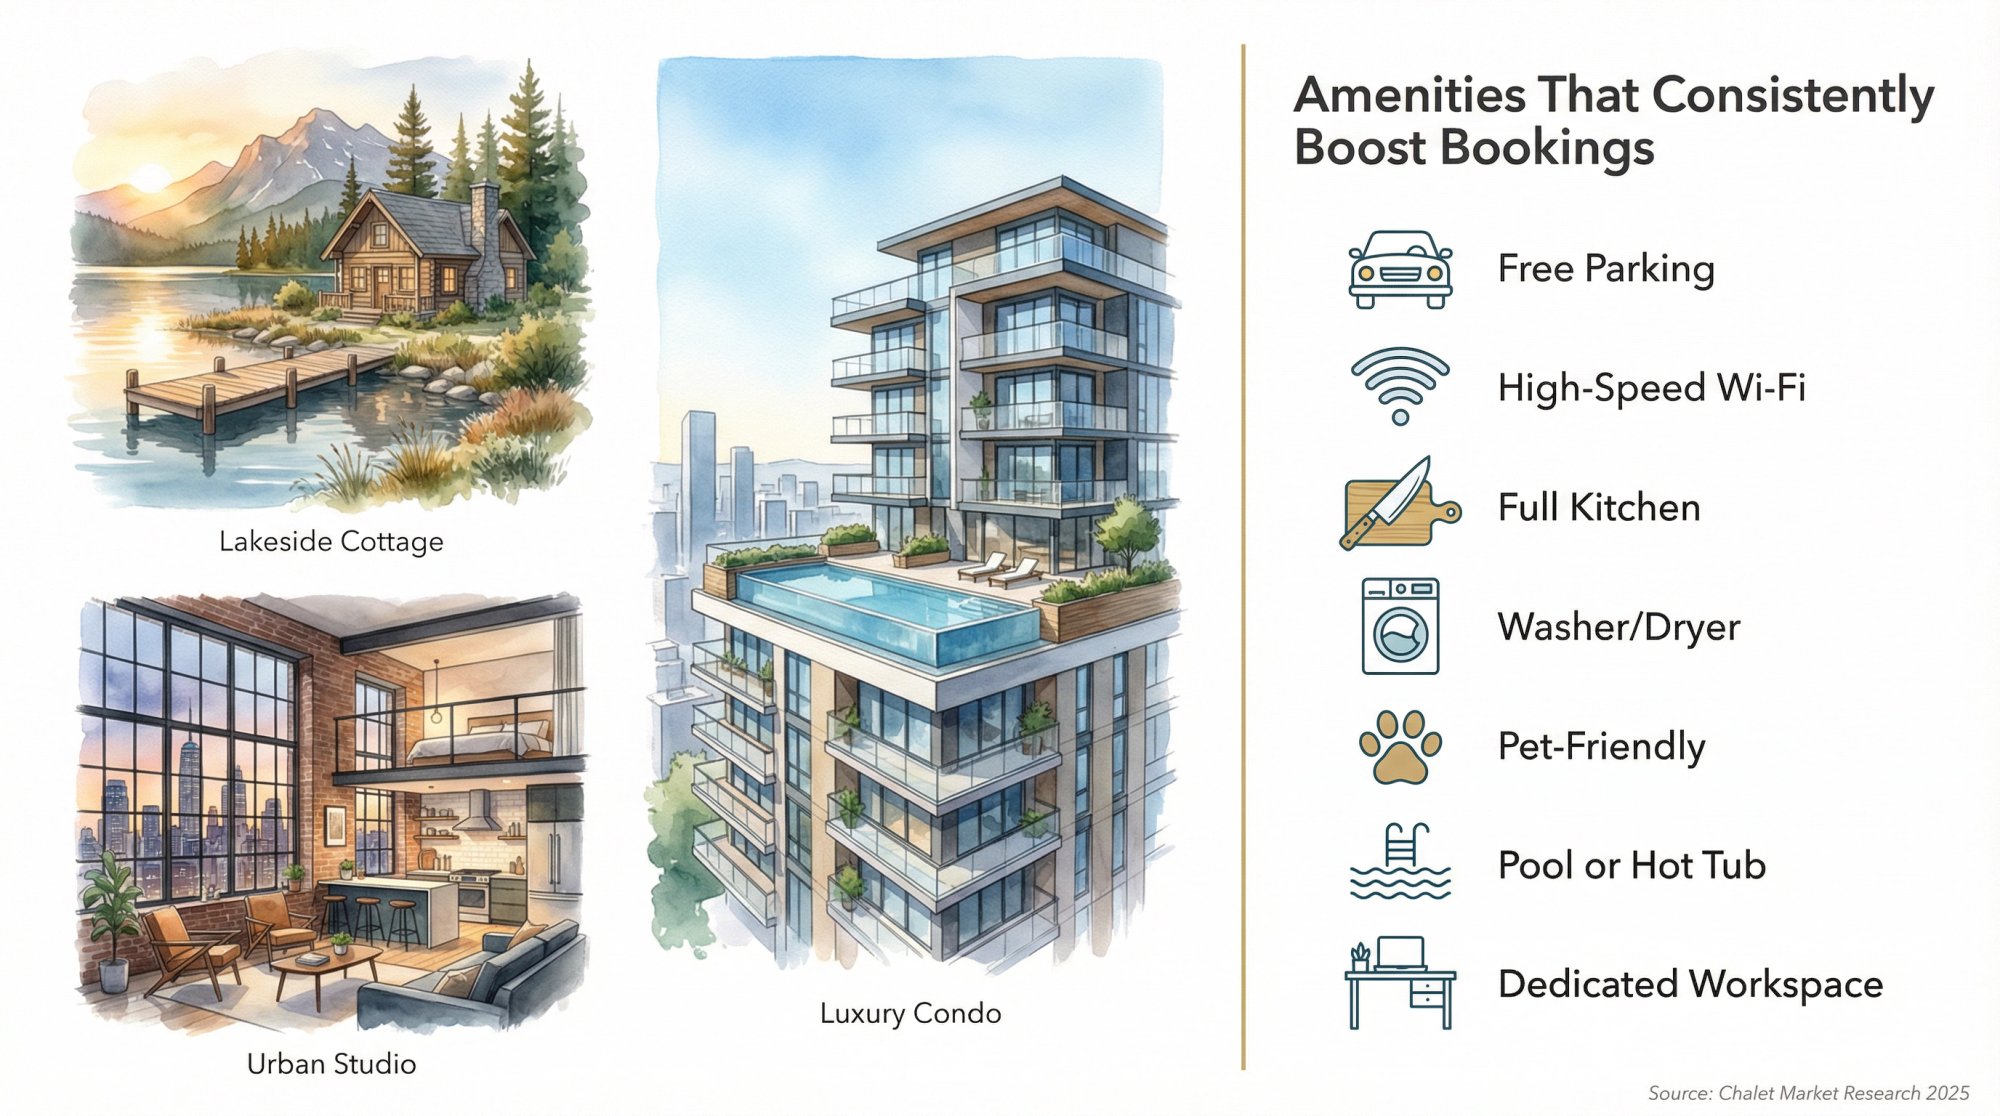
Amenities that consistently boost bookings:
-
Free parking
-
High-speed Wi-Fi
-
Full kitchen
-
Washer/dryer
-
Pet-friendliness
-
Pool or hot tub
The type of property also affects booking patterns. Larger homes might fill up on weekends with group trips but sit empty mid-week. A well-located studio could book steadily five or more nights per week from business travelers.
Pricing Strategy and Revenue Management
Dynamic pricing is the most direct lever you have for controlling occupancy. Hosts who regularly adjust prices to match demand keep their places booked without leaving money on the table. Pricing competitively during slow periods, offering discounts to fill last-minute gaps, or setting length-of-stay requirements can all influence your occupancy rate. The pitfalls of relying solely on online calculators explains why local market knowledge matters.
Responsive communication matters too. Fast inquiry replies and excellent reviews lead to more bookings. The Airbnb algorithm rewards hosts who provide great guest experiences.
Average Airbnb Occupancy Rates By City in the U.S.
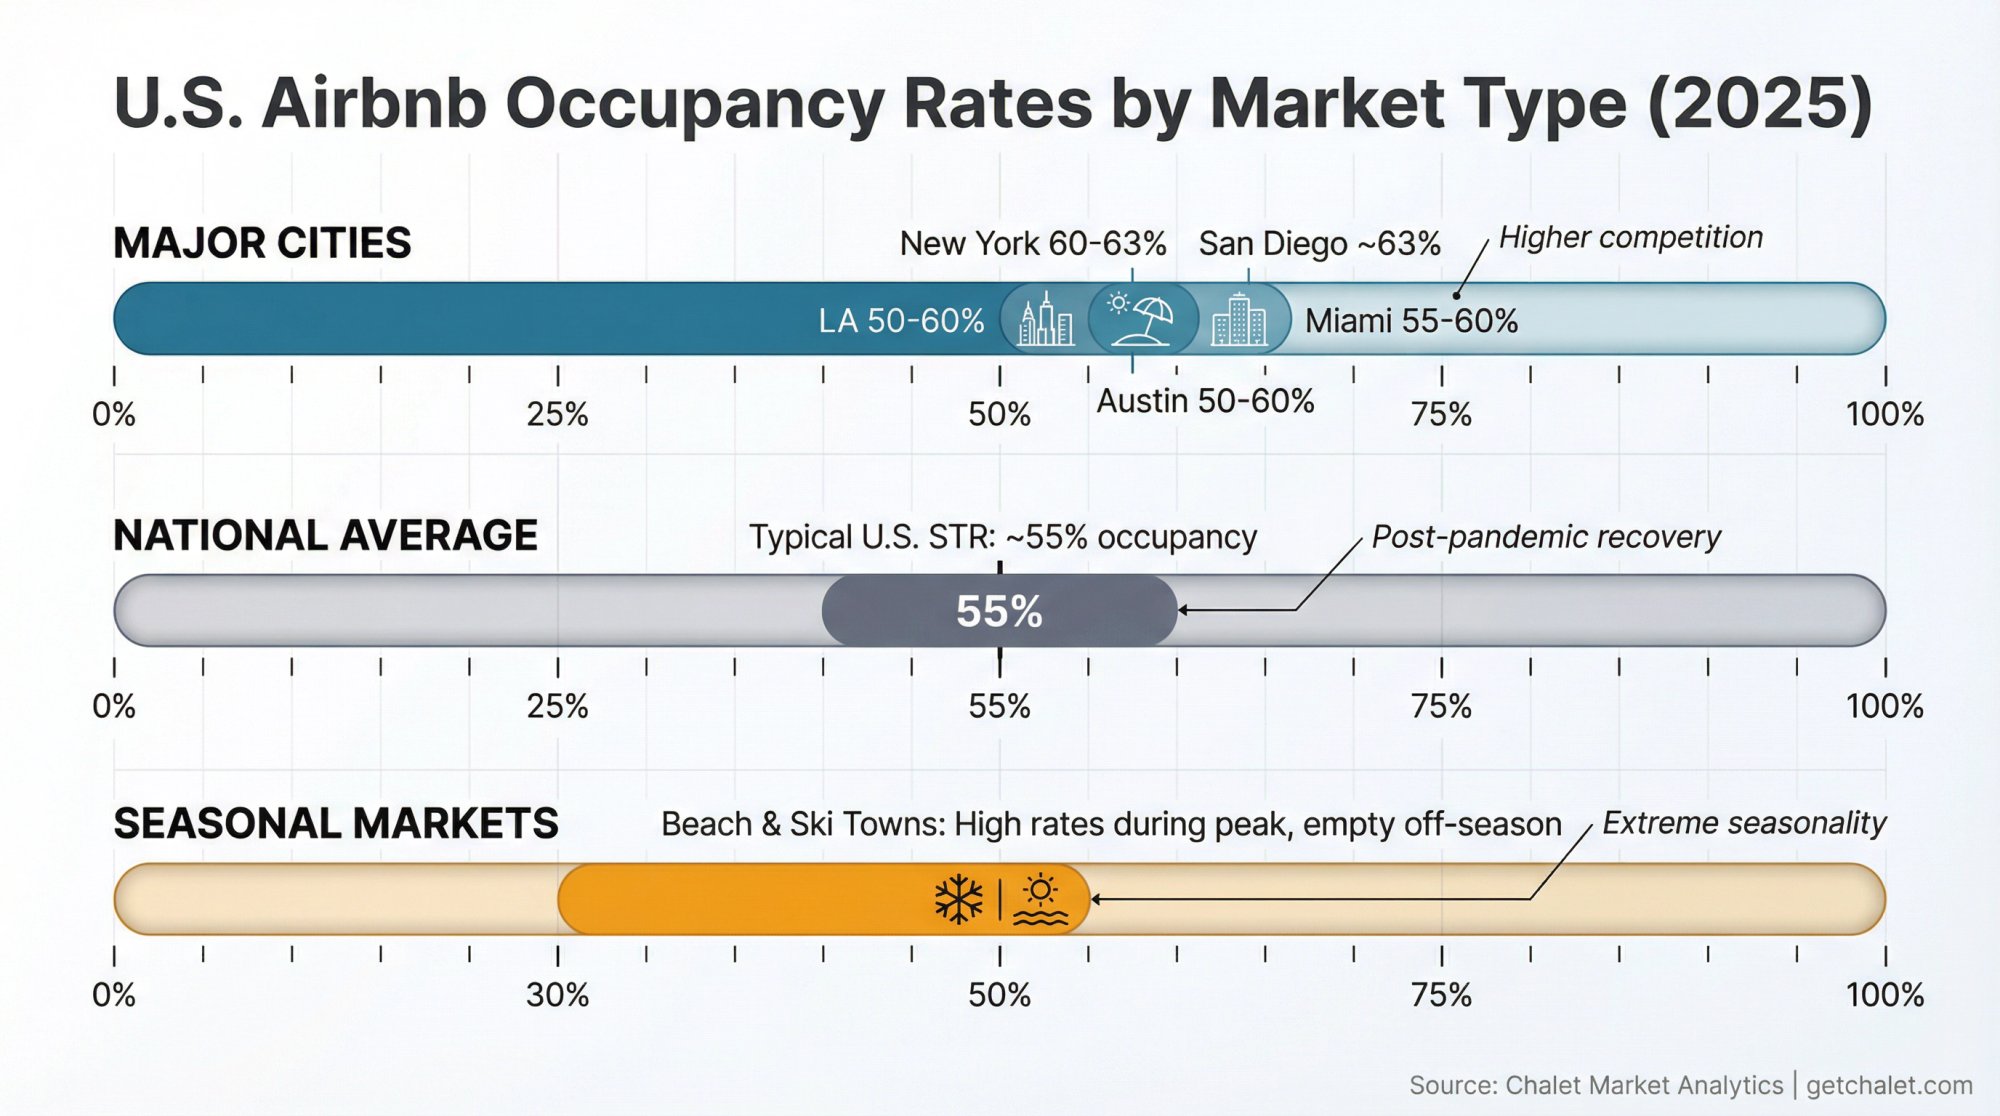
At a national level, U.S. Airbnb occupancy has fluctuated in the 50-60% range since the post-COVID recovery. After the 2020 slump, travel bounced back aggressively. By 2022, many markets hit record booking numbers. But the boom in new listings during 2023 created a more competitive landscape, pulling average occupancy down. Our comprehensive analysis of short-term rental markets breaks down these trends.
By mid-2025, national occupancy finally climbed back above pre-pandemic levels (around 55%). The typical Airbnb is now booked slightly more often than it was in 2019.
But "typical" is tricky because occupancy varies so dramatically by market type.
Major U.S. Cities: 55-65% Occupancy
Cities like New York, San Diego, Los Angeles, Miami, and Austin typically fall in the 55-65% range. These markets have enormous guest demand, but they also have enormous supply. If your downtown unit runs at 70% occupancy year-round, you're outperforming most competitors.
| City | Average Occupancy Range |
|---|---|
| New York City | 60-63% |
| San Diego | ~63% |
| Los Angeles | 50-60% |
| Miami | 55-60% |
| Austin | 50-60% |
For investors considering the Texas capital, our Austin short-term rental investment guide provides neighborhood-level insights.
Seasonal Beach and Ski Markets: 30-50% Occupancy
A ski resort town or summer beach enclave might only average 30-50% annually because half the year, tourists simply don't come. Cape Cod and Hamptons beach rentals often average under 40% occupancy over twelve months since nearly all their bookings happen between Memorial Day and Labor Day. Check out the best Airbnb coastal markets if beach properties interest you.
The trade-off: these markets often command very high nightly rates during peak season. A property earning $500/night for 120 peak nights might outperform one earning $200/night at 70% annual occupancy.
Regional and Drive-To Markets: 50-70% Occupancy
Medium-sized cities and drivable getaway destinations have seen sustained demand since the pandemic shifted travel patterns. Areas in the Smoky Mountains, parts of the Midwest, and mountain towns have performed surprisingly well. Our guides to best markets in the Smoky Mountains and best markets in the Midwestern US cover these opportunities.
Some of the highest occupancy figures in 2025 came from mid-sized markets where guest demand stayed strong without oversaturation of listings. Secondary markets often fly under the radar while outperforming famous tourist destinations.
Cities With Highest and Lowest Airbnb Occupancy in 2025
The contrast between top and bottom markets is striking. Understanding why certain cities perform well (or poorly) matters more than memorizing specific percentages.
Cities With the Highest Airbnb Occupancy Rates
According to 2025 market research, the top 10 highest-occupancy cities were all in California, each averaging roughly 81-86% occupancy for the year. Explore the best Airbnb markets in California for detailed analysis.
| City | Avg. Occupancy | Year-Over-Year Change |
|---|---|---|
| Whittier, CA | 86% | Up from 81% |
| Westminster, CA | ~84% | Increased |
| Van Nuys, CA | ~83% | Increased |
| Norwalk, CA | ~82% | Increased |
| Other LA/OC suburbs | 81-85% | Consistent |
These aren't traditional vacation hotspots like Hollywood or Disneyland. They're dense residential areas in the greater Los Angeles and Orange County region with consistent traveler demand (family visits, business travel, medical stays) and relatively few short-term rentals compared to tourist-heavy cities.
What these markets share: year-round demand, limited supply, and steady (not seasonal) booking patterns.
Cities With the Lowest Airbnb Occupancy Rates
The bottom of the occupancy rankings includes a mix of ultra-seasonal destinations and markets affected by regulatory changes.
| City | Avg. Occupancy | Notes |
|---|---|---|
| Wainscott, NY | ~11% | Hamptons beach town, extreme seasonality |
| Other Hamptons towns | 15-20% | Summer-only demand, massive supply |
| Pacifica, CA | ~21% | Dropped from 76% after regulatory crackdown |
| Montauk, NY | ~22% | Seasonal beach destination |
| Aspen, CO | ~24% | Ski season only |
| Ludlow, VT | ~28% | Short ski season |
Pacifica's collapse is particularly instructive. Going from 76% occupancy to 21% in a single year had nothing to do with traveler demand. The city enacted strict primary-residence rental rules (similar to nearby San Francisco), forcing many listings off the platform or into longer-term stays.
Local policy changes can tank occupancy overnight. Always verify current regulations before investing, especially in markets that look "too good to be true."
What High and Low Occupancy Markets Reveal
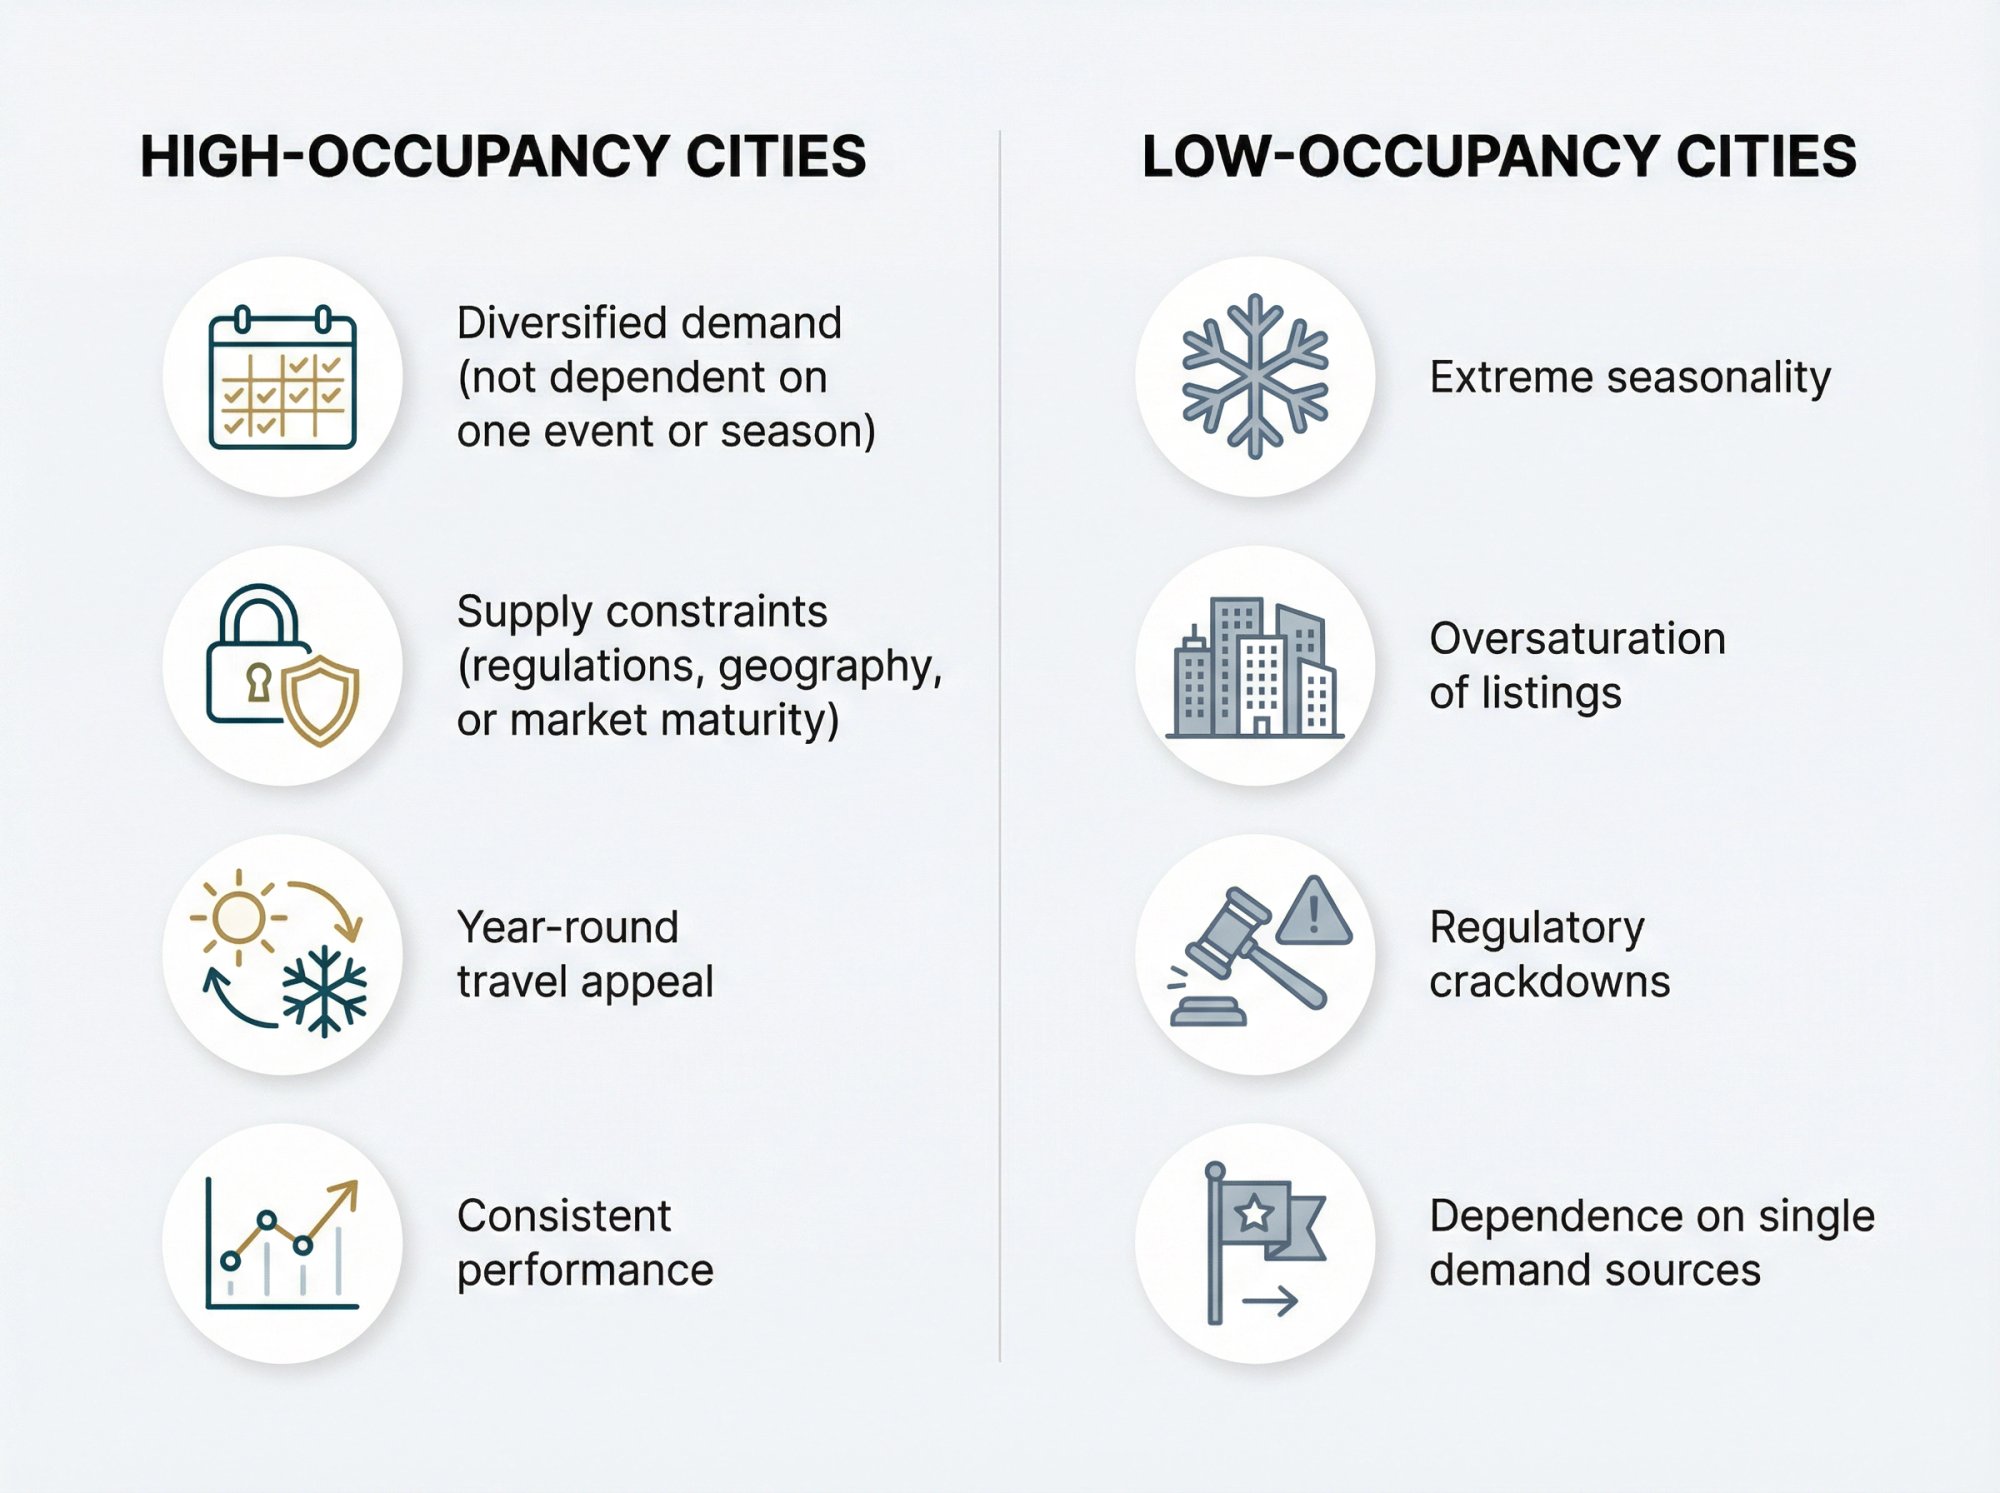
High-occupancy cities typically share these traits:
→ Diversified demand (not dependent on one event or season)
→ Supply constraints (regulations, geography, or market maturity)
→ Year-round travel appeal
Low-occupancy cities typically suffer from:
→ Extreme seasonality
→ Oversaturation of listings
→ Regulatory crackdowns
→ Dependence on single demand sources
When evaluating a market, dig into why the occupancy numbers look the way they do. An 85% occupancy market with strict permit limits might be extremely difficult to enter. A 30% market with upcoming regulatory changes might see supply decrease and occupancy improve. Our top Airbnb markets by occupancy rate article dives deeper into these dynamics.
Airbnb Occupancy Rates in Canada, UK, and Australia
Airbnb occupancy patterns outside the U.S. follow similar principles, though local factors create distinct market conditions.
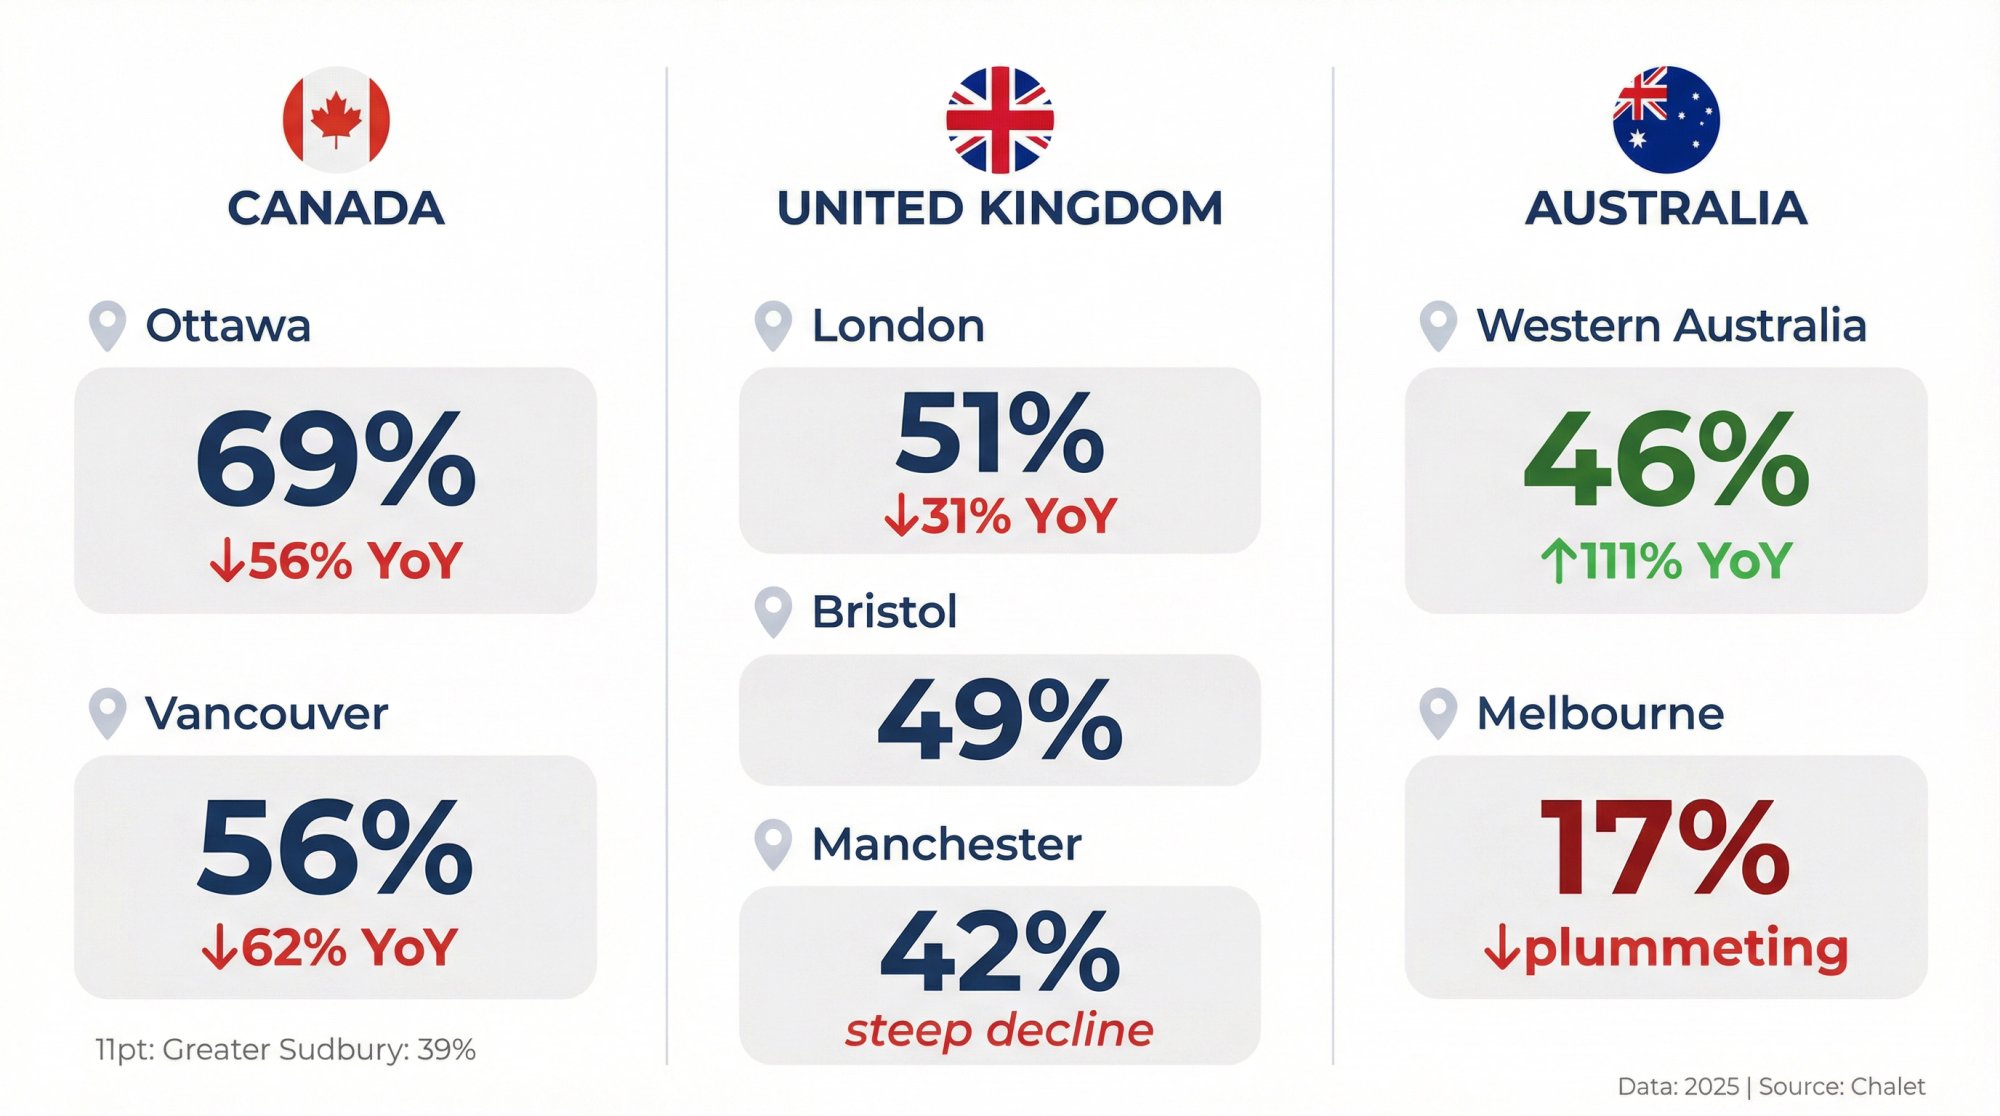
Canada Airbnb Occupancy Rates
Major Canadian cities saw occupancy declines in 2025:
-
Ottawa: ~69% average (down 56% year-over-year)
-
Vancouver: ~56% average (down 62% year-over-year)
Vancouver's dramatic drop resulted from new city regulations limiting short-term rentals to primary residences. Many listings either left the market or shifted to mid-term stays.
Smaller markets like Greater Sudbury (~39% occupancy) held relatively steady, benefiting from stable regional travel demand.
United Kingdom Airbnb Occupancy Rates
UK markets face similar pressures:
-
London: ~51% average (down 31% year-over-year)
-
Bristol: ~49% average
-
Greater Manchester: ~42% average (steep declines)
The UK has been considering stricter registration requirements for short-term rentals. London hosts have pivoted toward business-friendly amenities and longer stays to maintain bookings.
Australia Airbnb Occupancy Rates
Australia shows the starkest regional contrast:
-
Western Australia: ~46% average (up 111% year-over-year)
-
Melbourne: ~17% average (plummeting)
Western Australia's surge came from booming domestic tourism and relatively permissive regulations. Melbourne's collapse reflects strict local rules, market saturation, and shifting travel patterns. Many Melbourne hosts have pivoted to 30+ day bookings or cut prices dramatically.
The pattern globally: if demand grows faster than supply (or supply gets constrained), occupancy rises. If supply grows unchecked while demand stagnates, occupancy falls.
7 Ways to Improve Your Airbnb Occupancy Rate
Whether you're underperforming your market average or trying to squeeze a few extra percentage points out of an already-successful listing, these strategies work.
Use Dynamic Pricing to Maximize Bookings
Pricing is the lever for occupancy. Set your rate too high, and price-sensitive guests book elsewhere. Set it too low, and you fill up but sacrifice revenue.
The sweet spot: raise prices during high-demand periods (even if occupancy drops slightly, you make up for it in revenue) and lower prices during slow seasons or for last-minute gaps to capture bookings you'd otherwise lose.
Consider using dynamic pricing software or at minimum track what competitors charge throughout the year. Learn how to optimize your Airbnb listing for maximum bookings with our comprehensive guide.
Upgrade Your Listing Photos and Amenities
Occupancy isn't just about numbers. It's about people choosing your property. Great photos, a responsive host profile, and standout amenities all influence booking decisions.
Amenities that consistently expand your guest pool:
-
Pool or hot tub
-
High-speed Wi-Fi (essential for remote workers)
-
Full kitchen
-
Free parking
-
Pet-friendliness
-
Dedicated workspace
Match your amenities to your target guest. Families value cribs and blackout curtains. Remote workers need reliable internet and a proper desk.
Build 5-Star Reviews Consistently
A 4.8-star property books far more often than a 4.2-star one. Ask guests proactively for reviews. Address issues immediately. Future guests read those reviews and decide based on what past guests experienced.
This is non-negotiable for building occupancy over time.
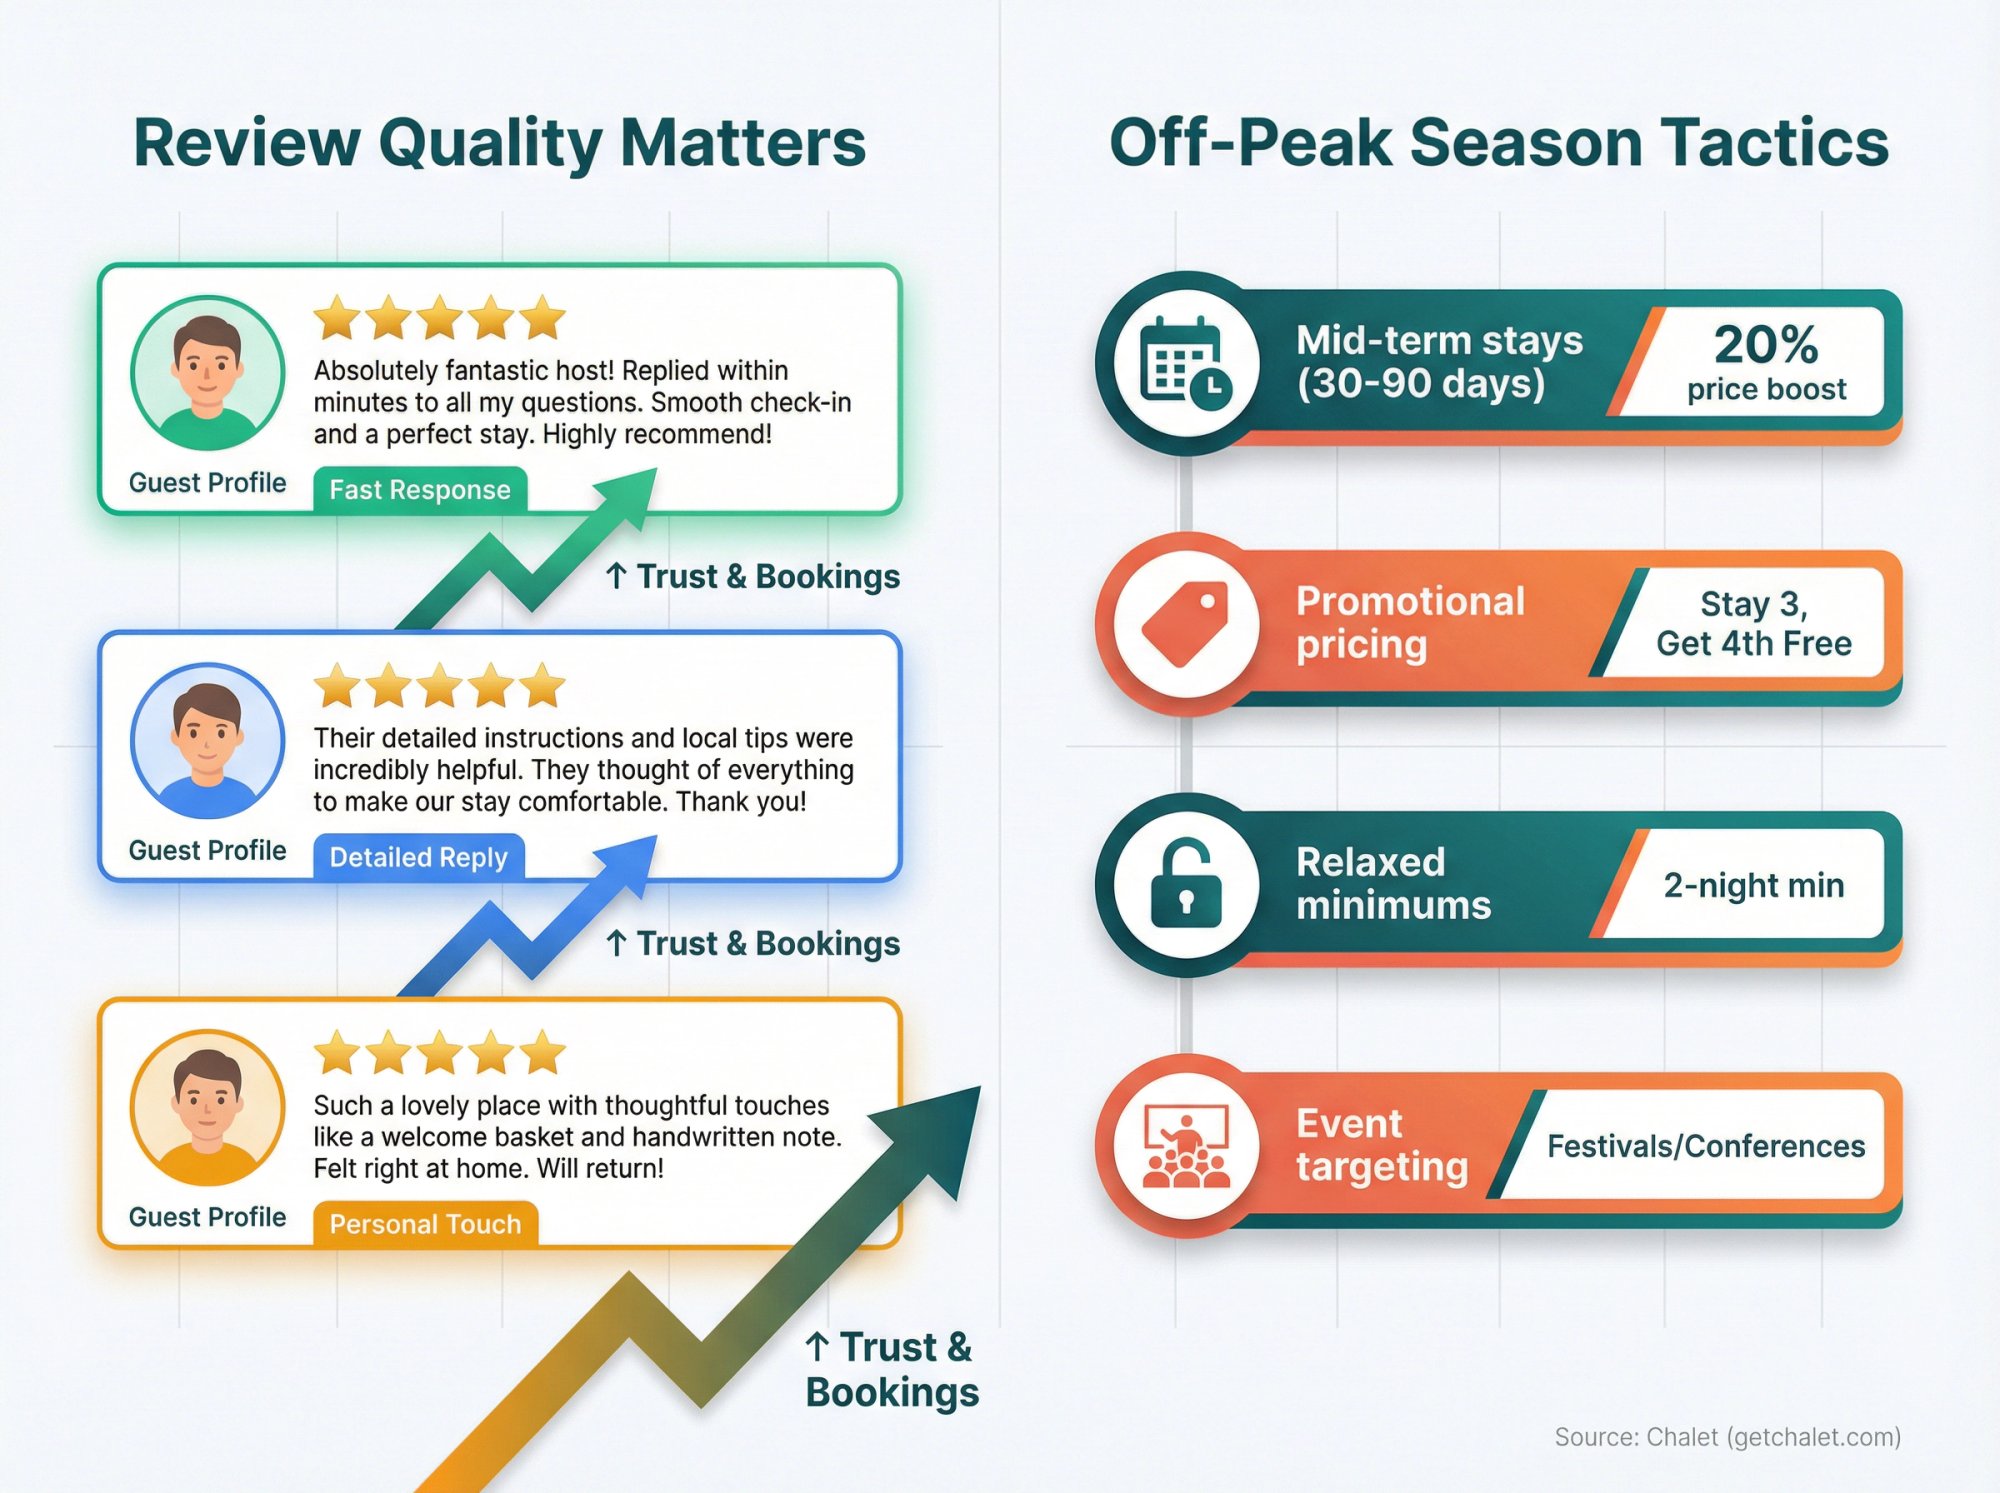
How to Fill Slow Seasons and Off-Peak Months
In off-peak periods, consider:
① Mid-term stays (30-90 days) for traveling nurses, contractors, or digital nomads
② Promotional pricing like "stay 3 nights, get the 4th free"
③ Relaxed minimum-night requirements to capture shorter bookings
④ Event targeting for festivals, conferences, or sports events in your area
The worst strategy? Accepting that "nobody comes in October" and doing nothing. A steep 20% discount on monthly rates might land you a traveling professor or retiree seeking a quiet extended stay. That beats sitting empty. The rise of mid-term rentals in 2025 offers smart diversification strategies.
List on Airbnb, Vrbo, and Booking.com
Don't rely solely on Airbnb's search algorithm. Many hosts list on Vrbo, Booking.com, and other platforms to increase exposure. Just sync your calendars carefully to avoid double-bookings.
If you have a unique property, consider social media marketing or reaching out to travel bloggers. Sometimes a little PR positions your place as the spot to stay.
When to Hire a Property Manager
Managing occupancy, pricing, and guest communications takes time. Professional property managers often use advanced revenue management tools that keep properties booked more consistently. They also handle multi-platform listings and guest communications that can influence your search ranking. Understanding different property management styles helps you decide what works best for your situation.
Even if you self-manage, tools like dynamic pricing software or automated messaging systems can help. For investors weighing the decision, our guide on maximizing your investment through self-management lays out the pros and cons.
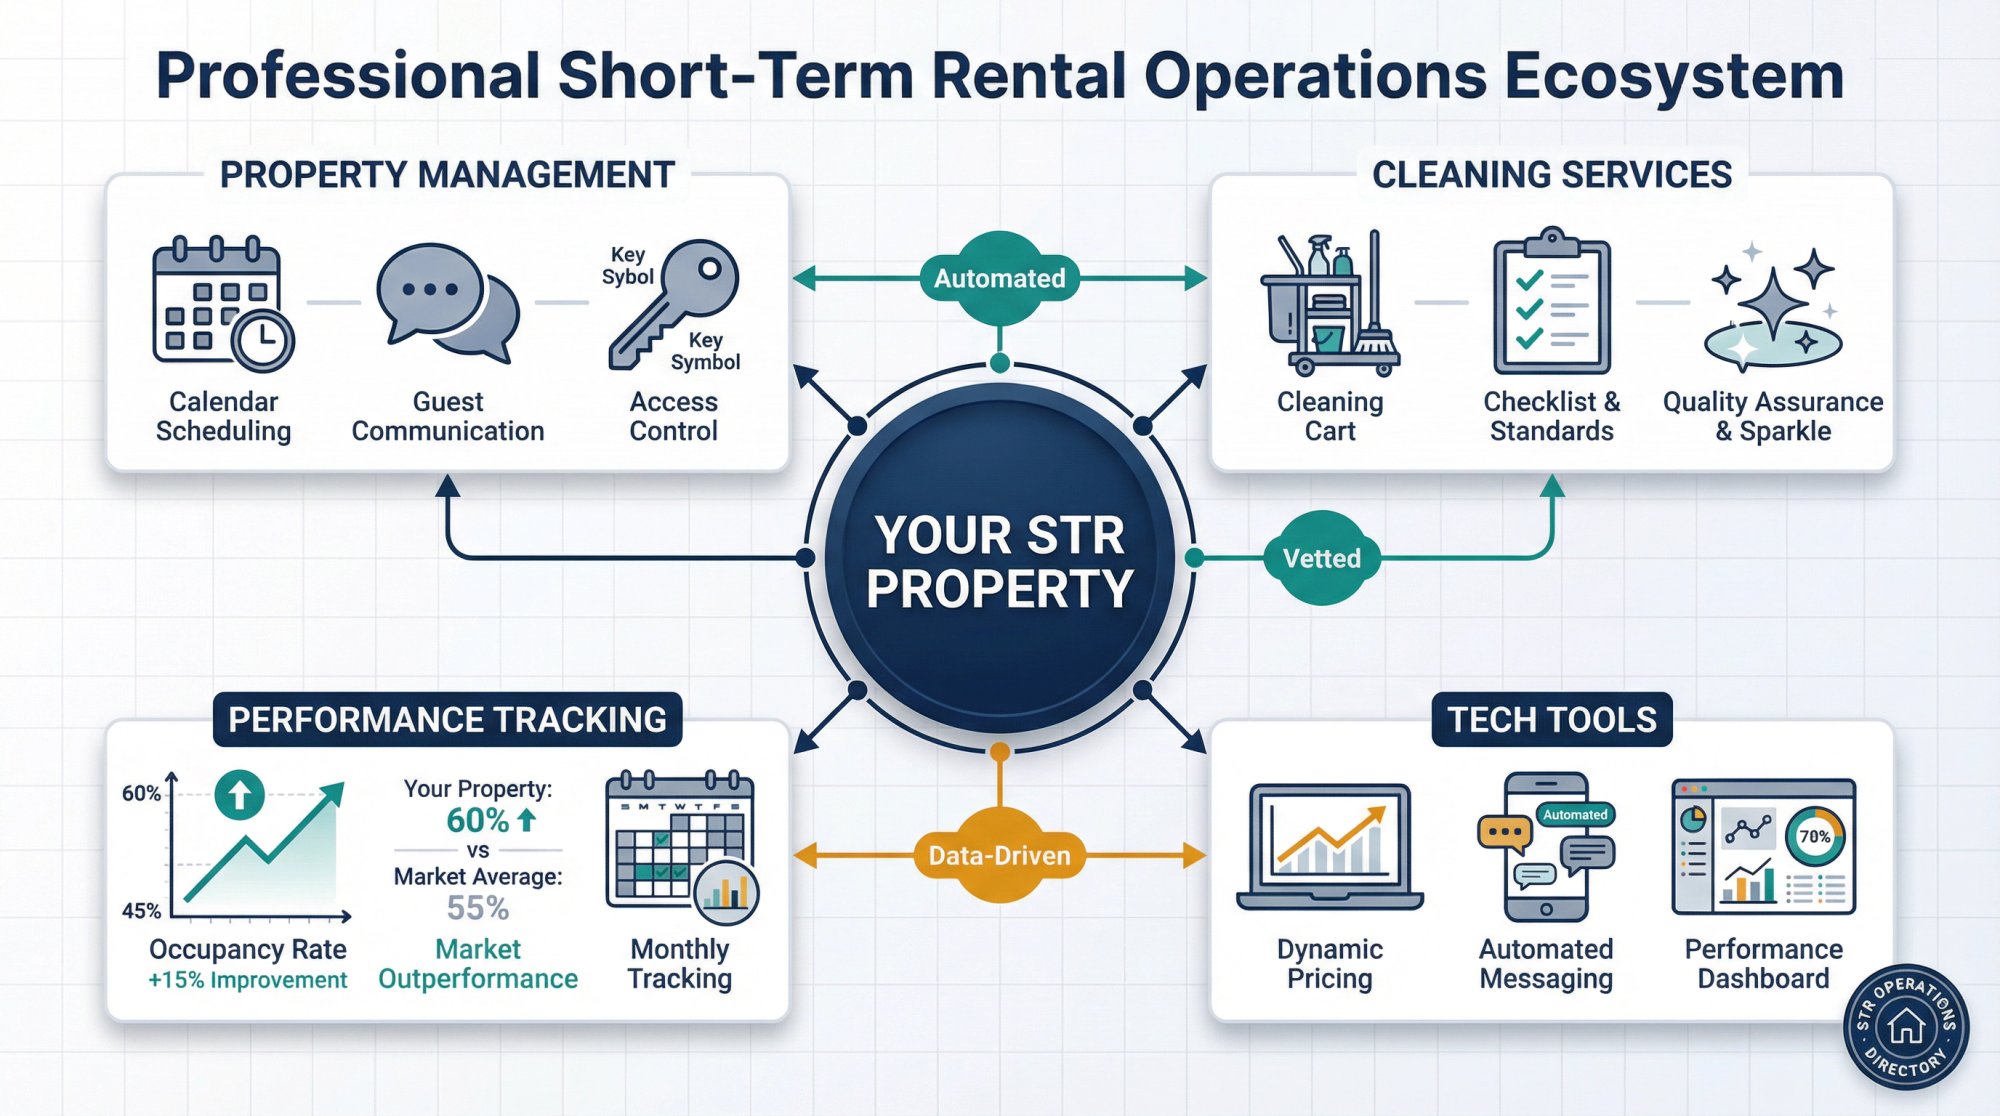
Chalet connects you with vetted cleaning services, property managers, and tech tools through our STR Operations Directory. Using these professionals can free up your time and potentially raise occupancy by ensuring nothing falls through the cracks.
Track Performance and Adjust Monthly
Improving occupancy is an ongoing process, not a one-time fix. Track your listing's performance against your market's averages. If the city average is 55% and you're at 45%, dig into the why. Do you need better reviews? Is your pricing too high on weekdays? Are nearby listings offering something you don't?
Small occupancy improvements compound. Going from 50% to 60% occupancy can significantly boost your annual revenue without requiring any additional properties.
How to Find High-Occupancy Airbnb Markets With Chalet
Finding accurate occupancy data for potential investment markets used to require expensive subscriptions or hours of manual research. Chalet changes that equation with free tools that rival paid alternatives.
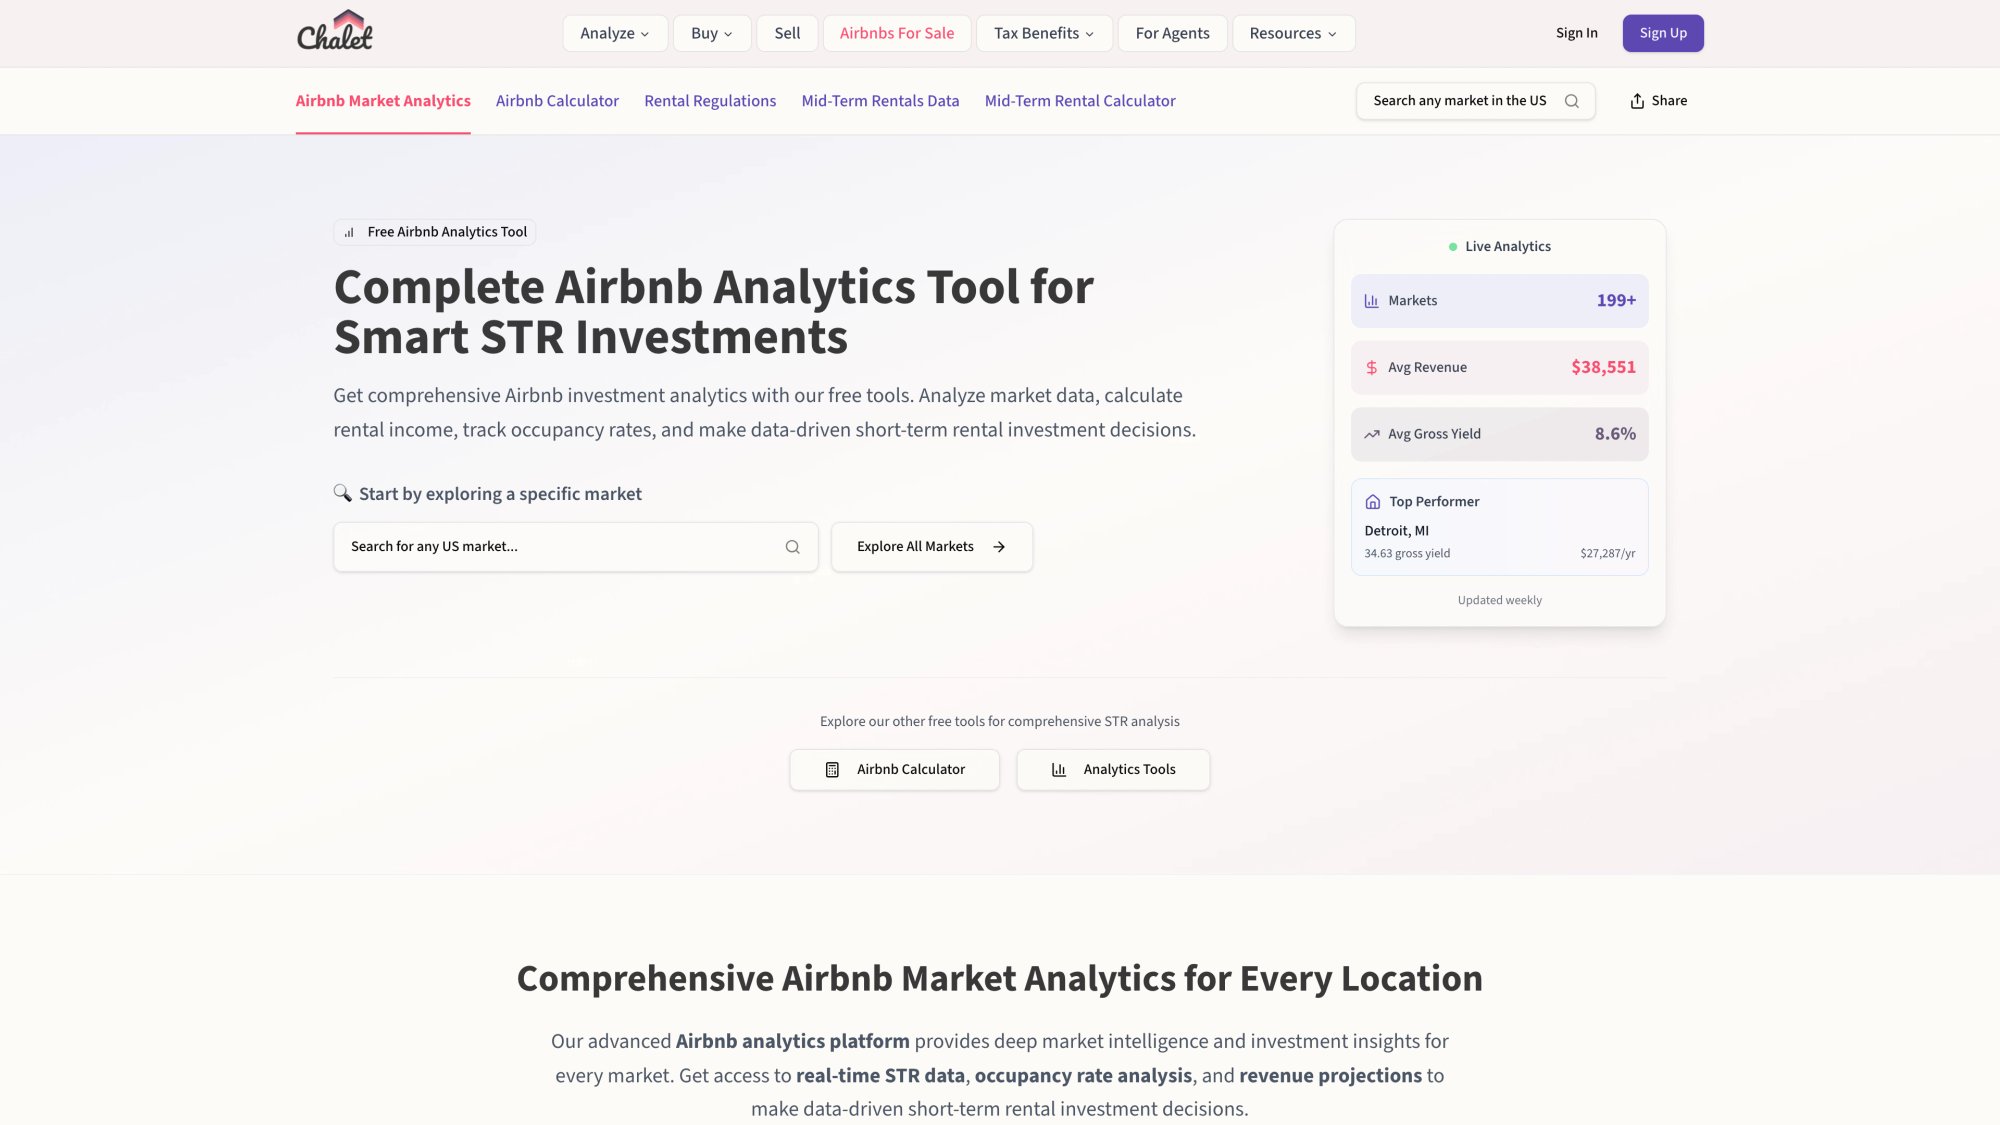
Free Airbnb Market Analytics
Our market analytics tool provides real-time occupancy, ADR, and revenue benchmarks for cities across the U.S. Pull up charts for Austin, Nashville, or any market you're considering. See how occupancy trends throughout the year, not just a single annual average. Identify seasonal patterns before you buy. For comparison of available options, see our 2025 Airbnb analytics tools comparison.
This data is 100% free. No subscription required. No paywall.
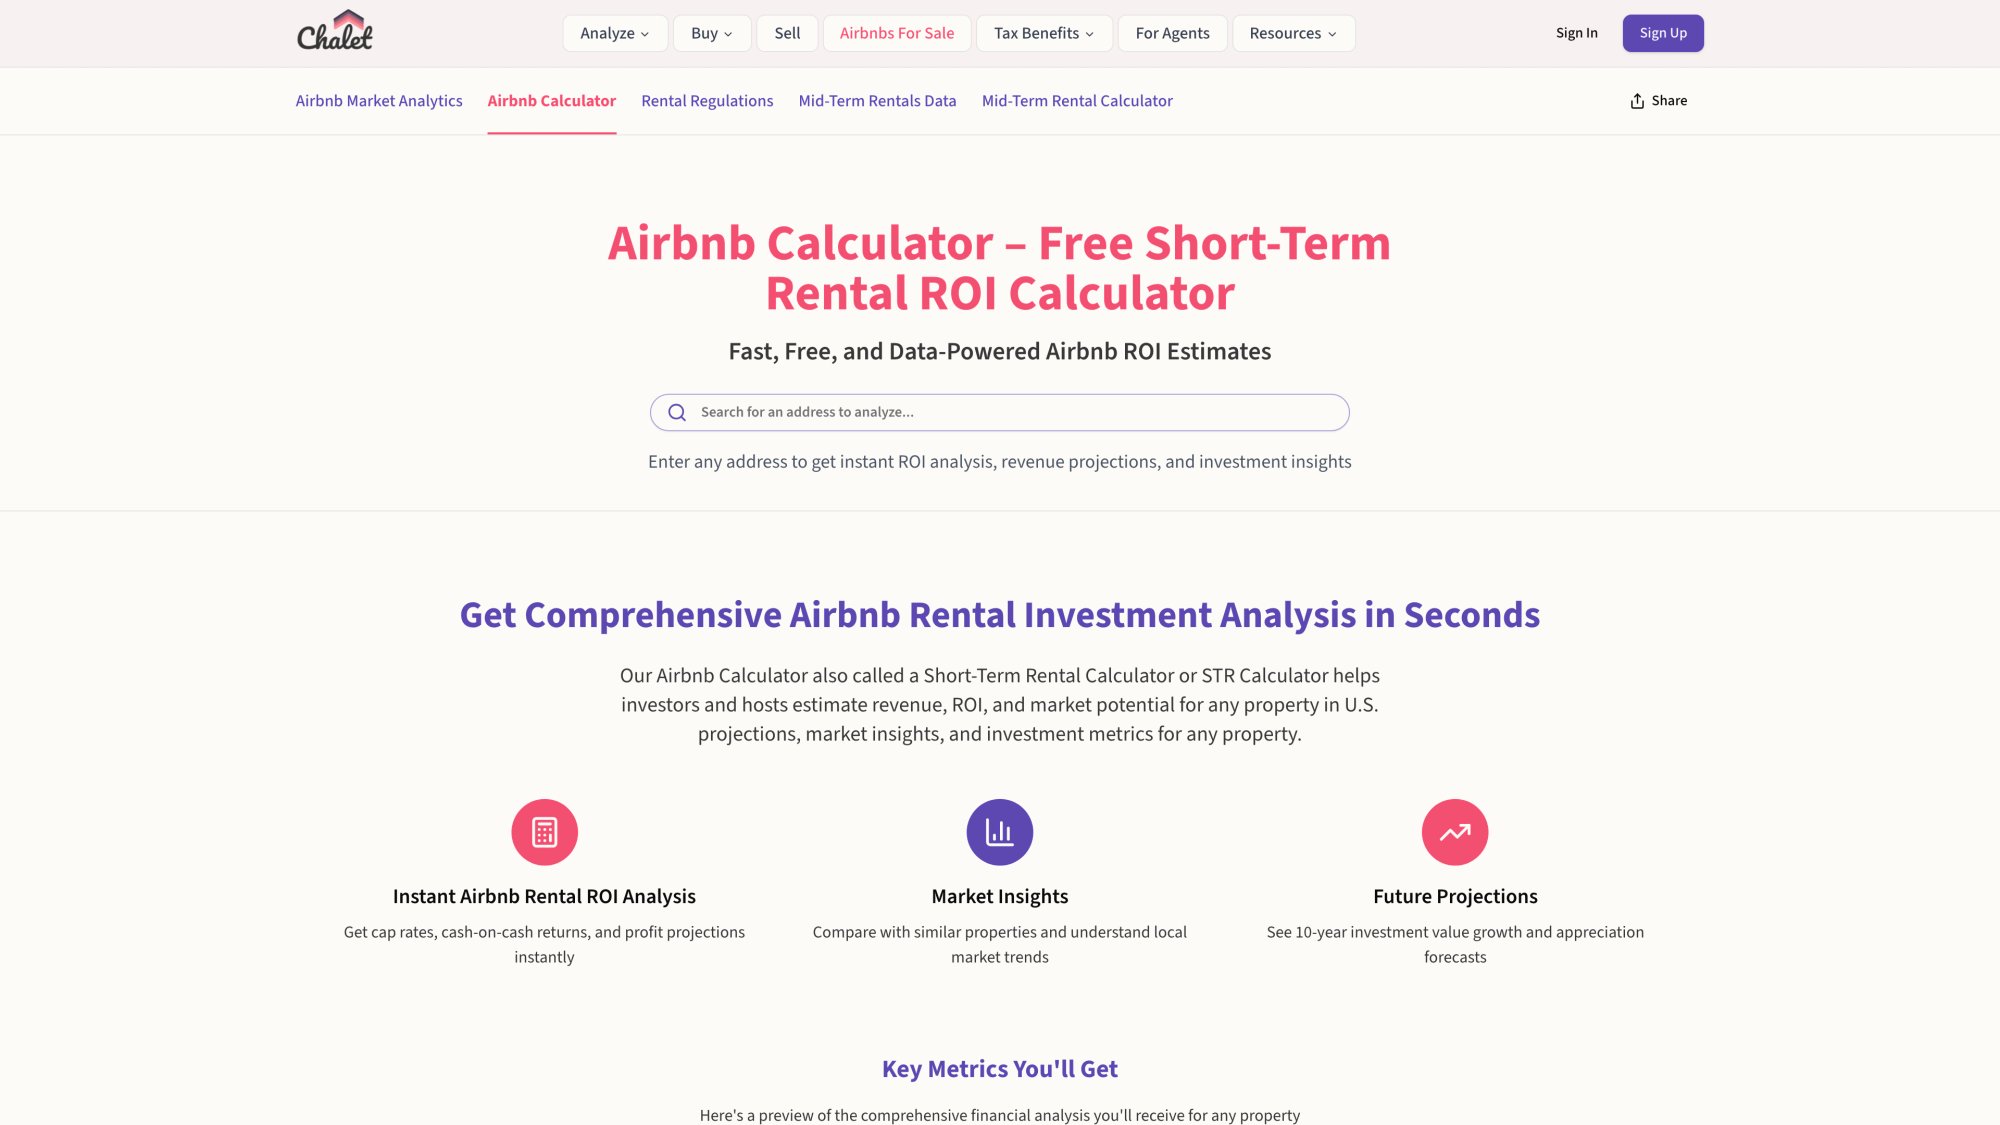
ROI and DSCR Calculators for STR Investors
Once you've identified promising markets, our ROI calculator helps you run numbers on specific properties. Input an address and see estimated cash flow, cap rate, and whether the property could qualify for DSCR financing. For detailed analysis techniques, our guide on the best Airbnb calculator explains what to look for. You can also use our STR underwriting tool for more advanced deal analysis.
Make investment decisions based on projections grounded in actual market data.
STR Regulation Database
We maintain a comprehensive STR regulation database covering permit requirements, occupancy limits, and local rules for markets nationwide. Before you fall in love with a high-occupancy city, verify that you can actually operate there legally.
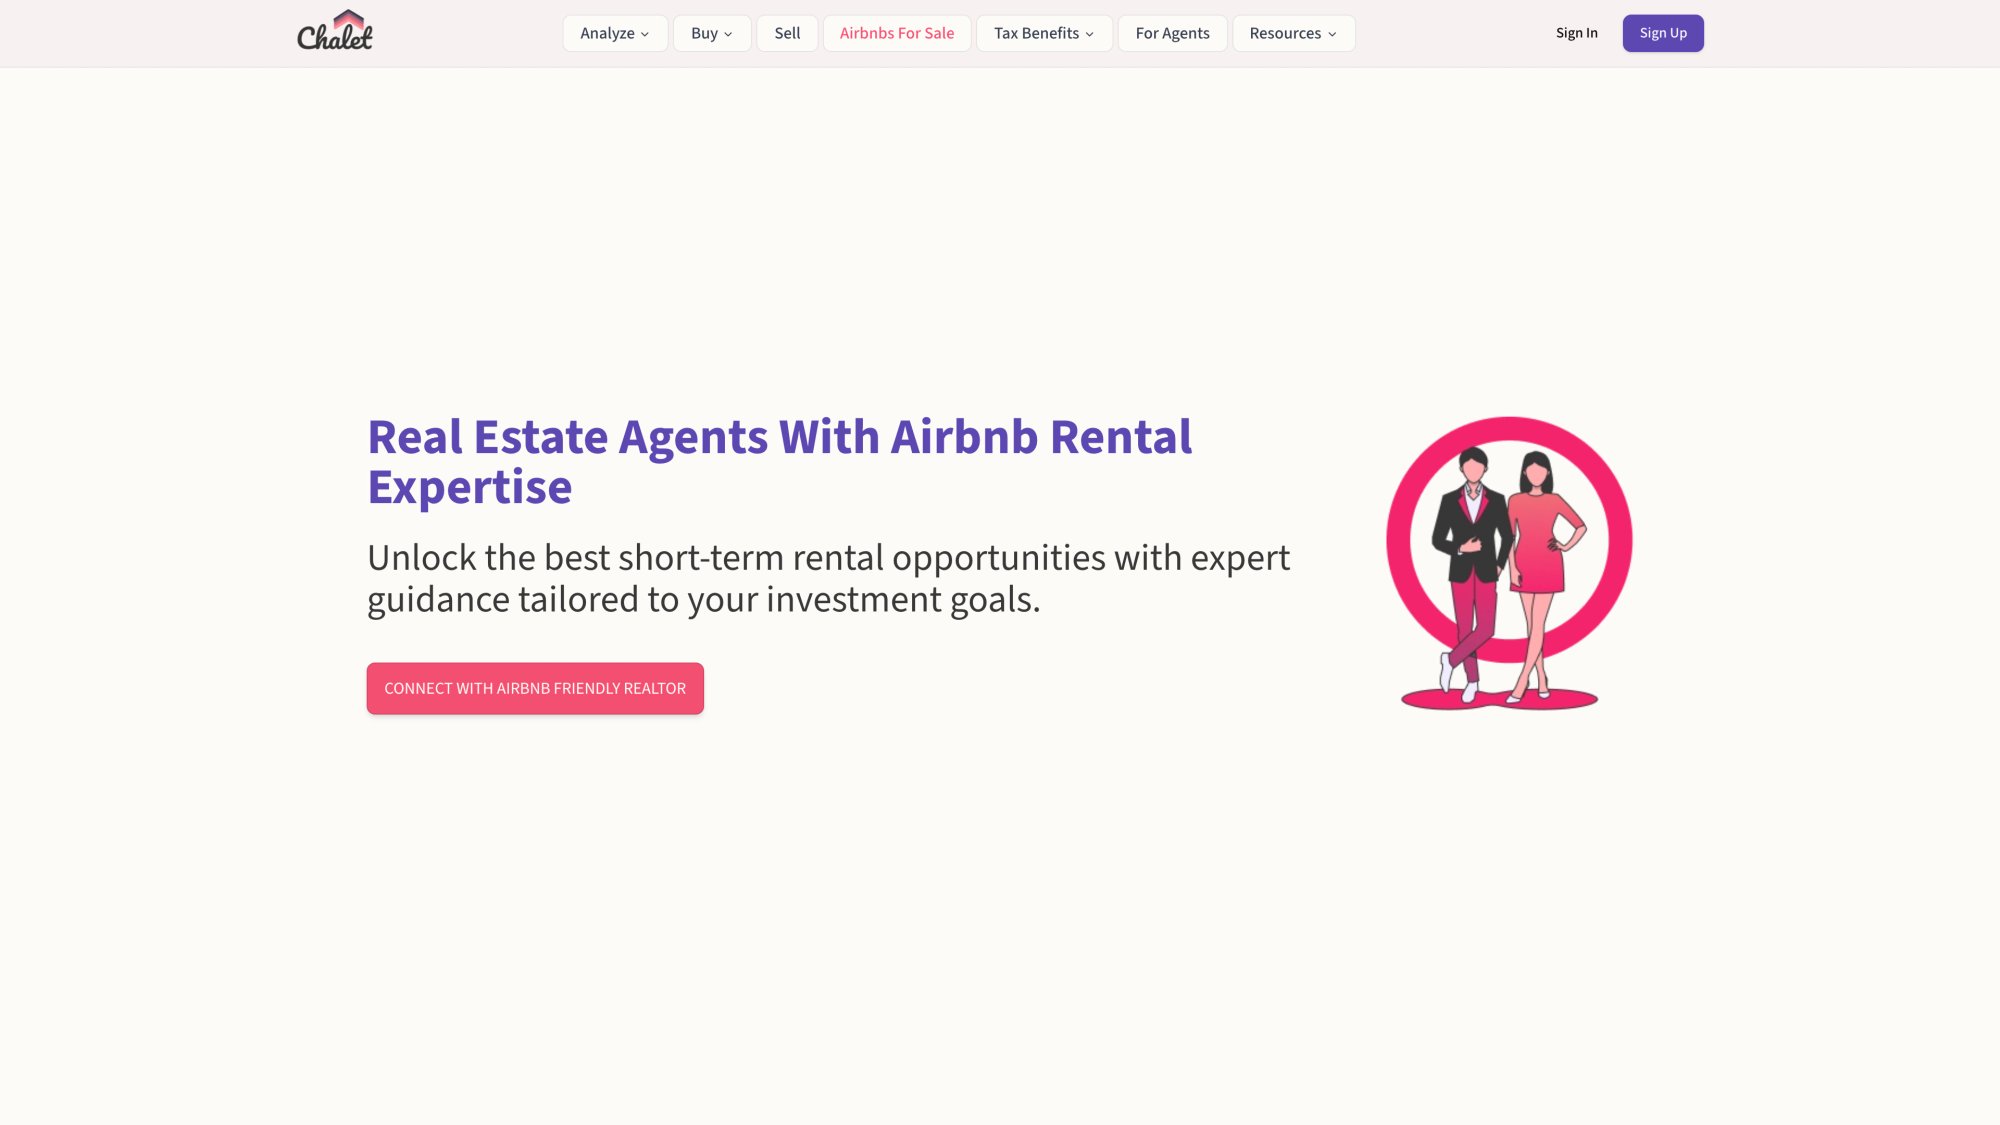
Airbnb-Savvy Real Estate Agents and Vendors
Numbers only tell part of the story. Chalet connects you with Airbnb-savvy real estate agents who understand local STR dynamics. They'll advise on the best neighborhoods (and which areas to avoid due to permits or low demand) so you invest with confidence. Learn more about the benefits of working with STR-specialist agents.
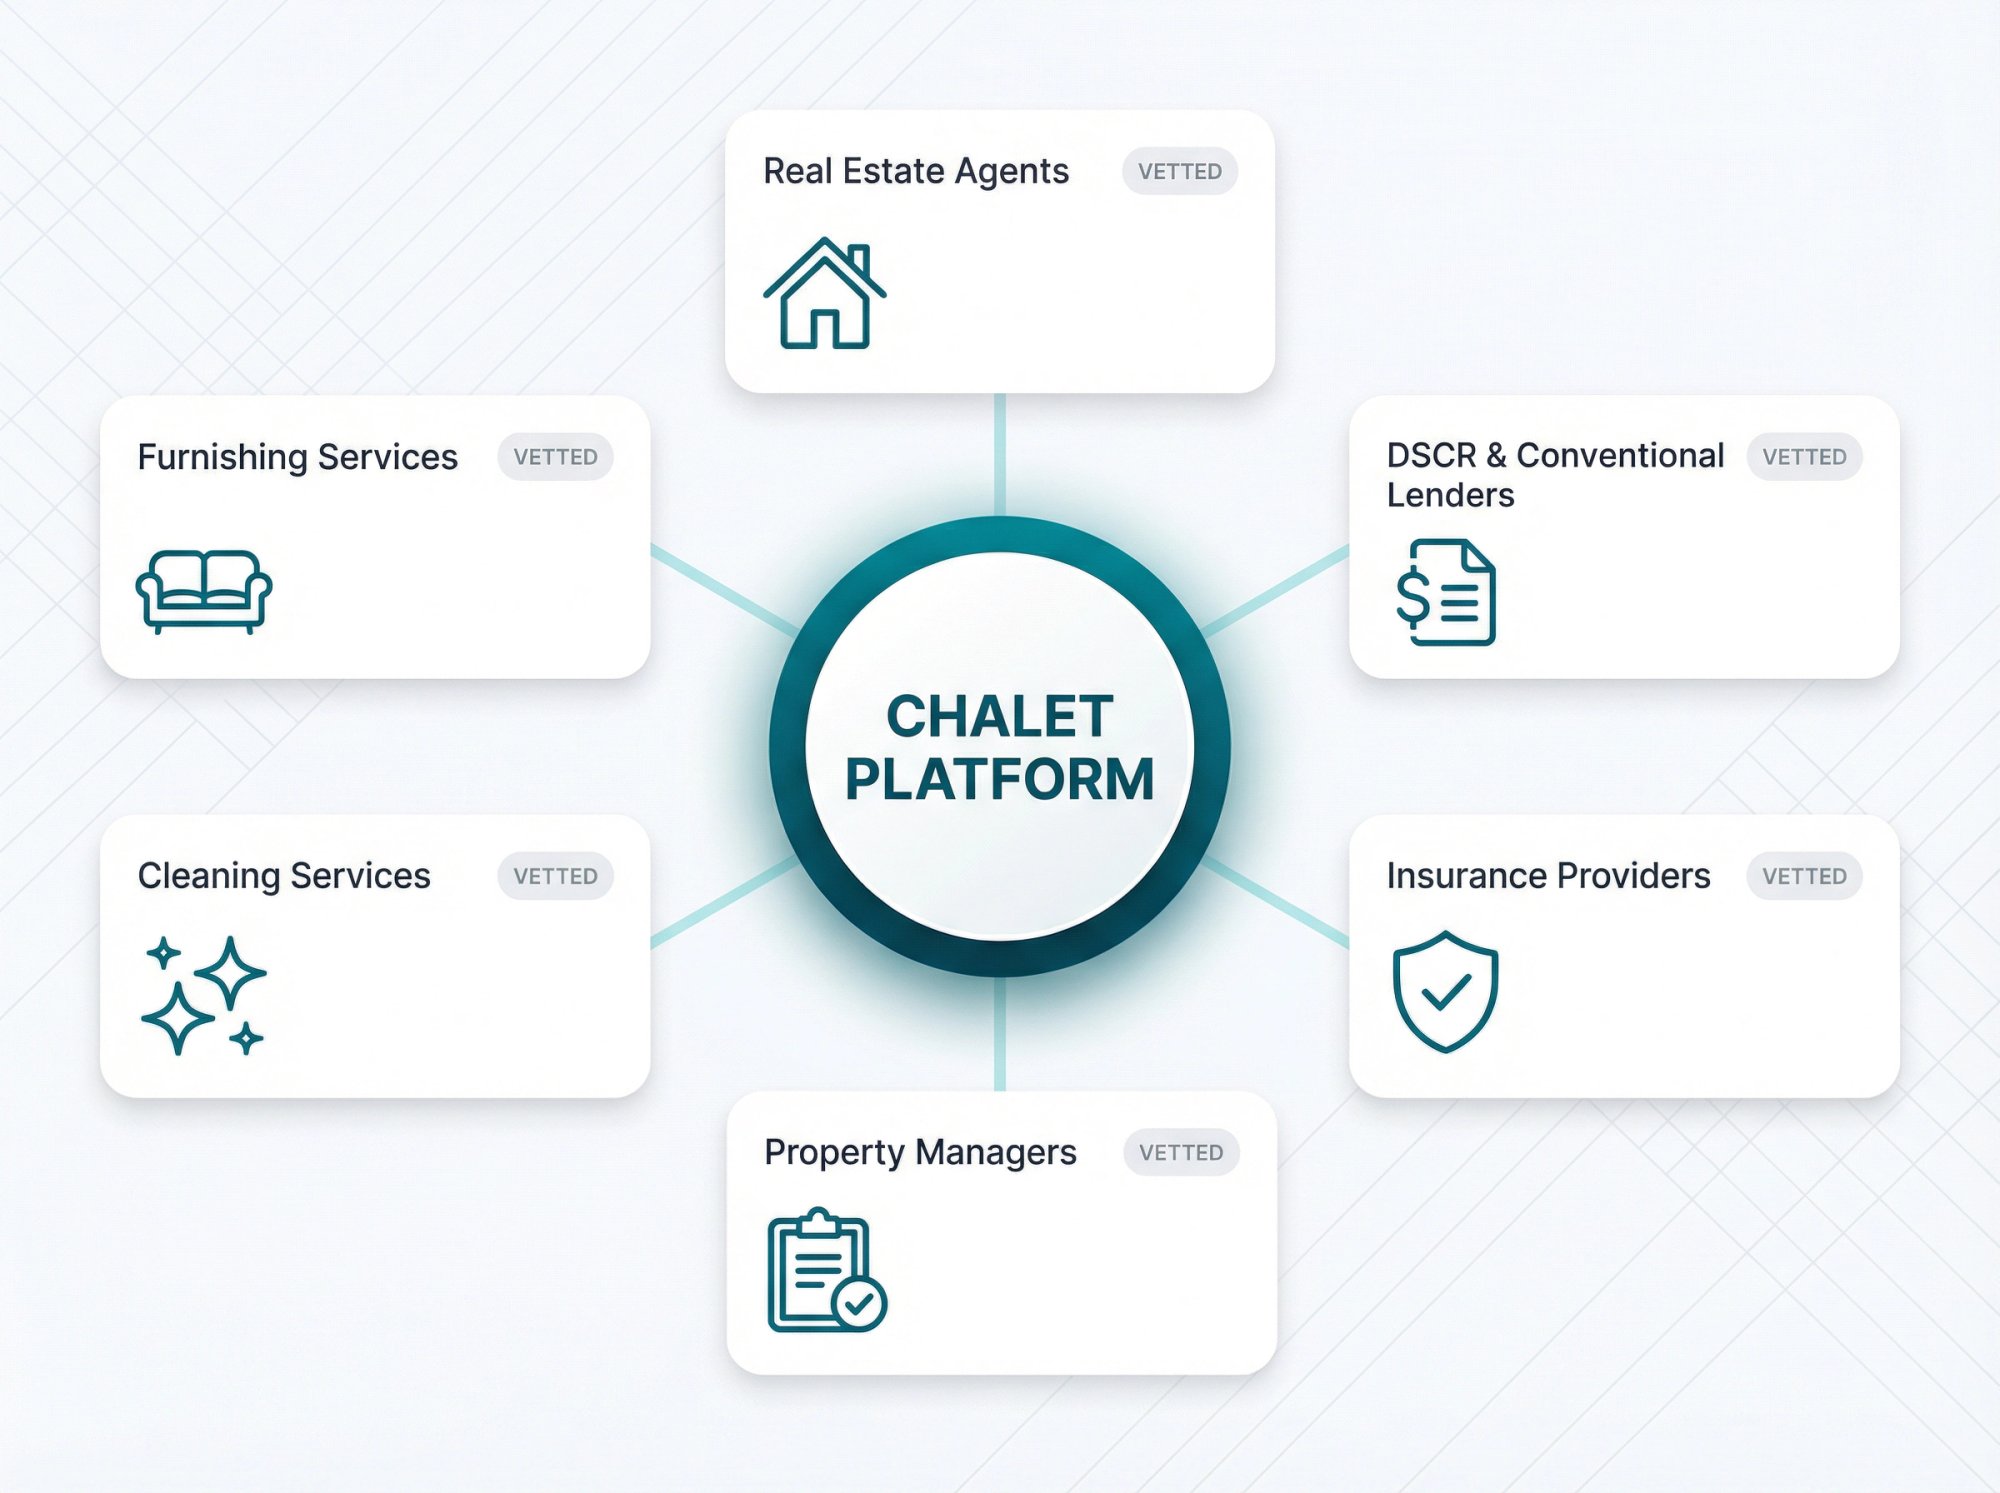
We've also built a vetted network of:
-
DSCR and conventional lenders experienced with STR purchases
-
Insurance providers who cover short-term rentals
-
Property managers with local market expertise
-
Cleaning and furnishing services to get you operational quickly
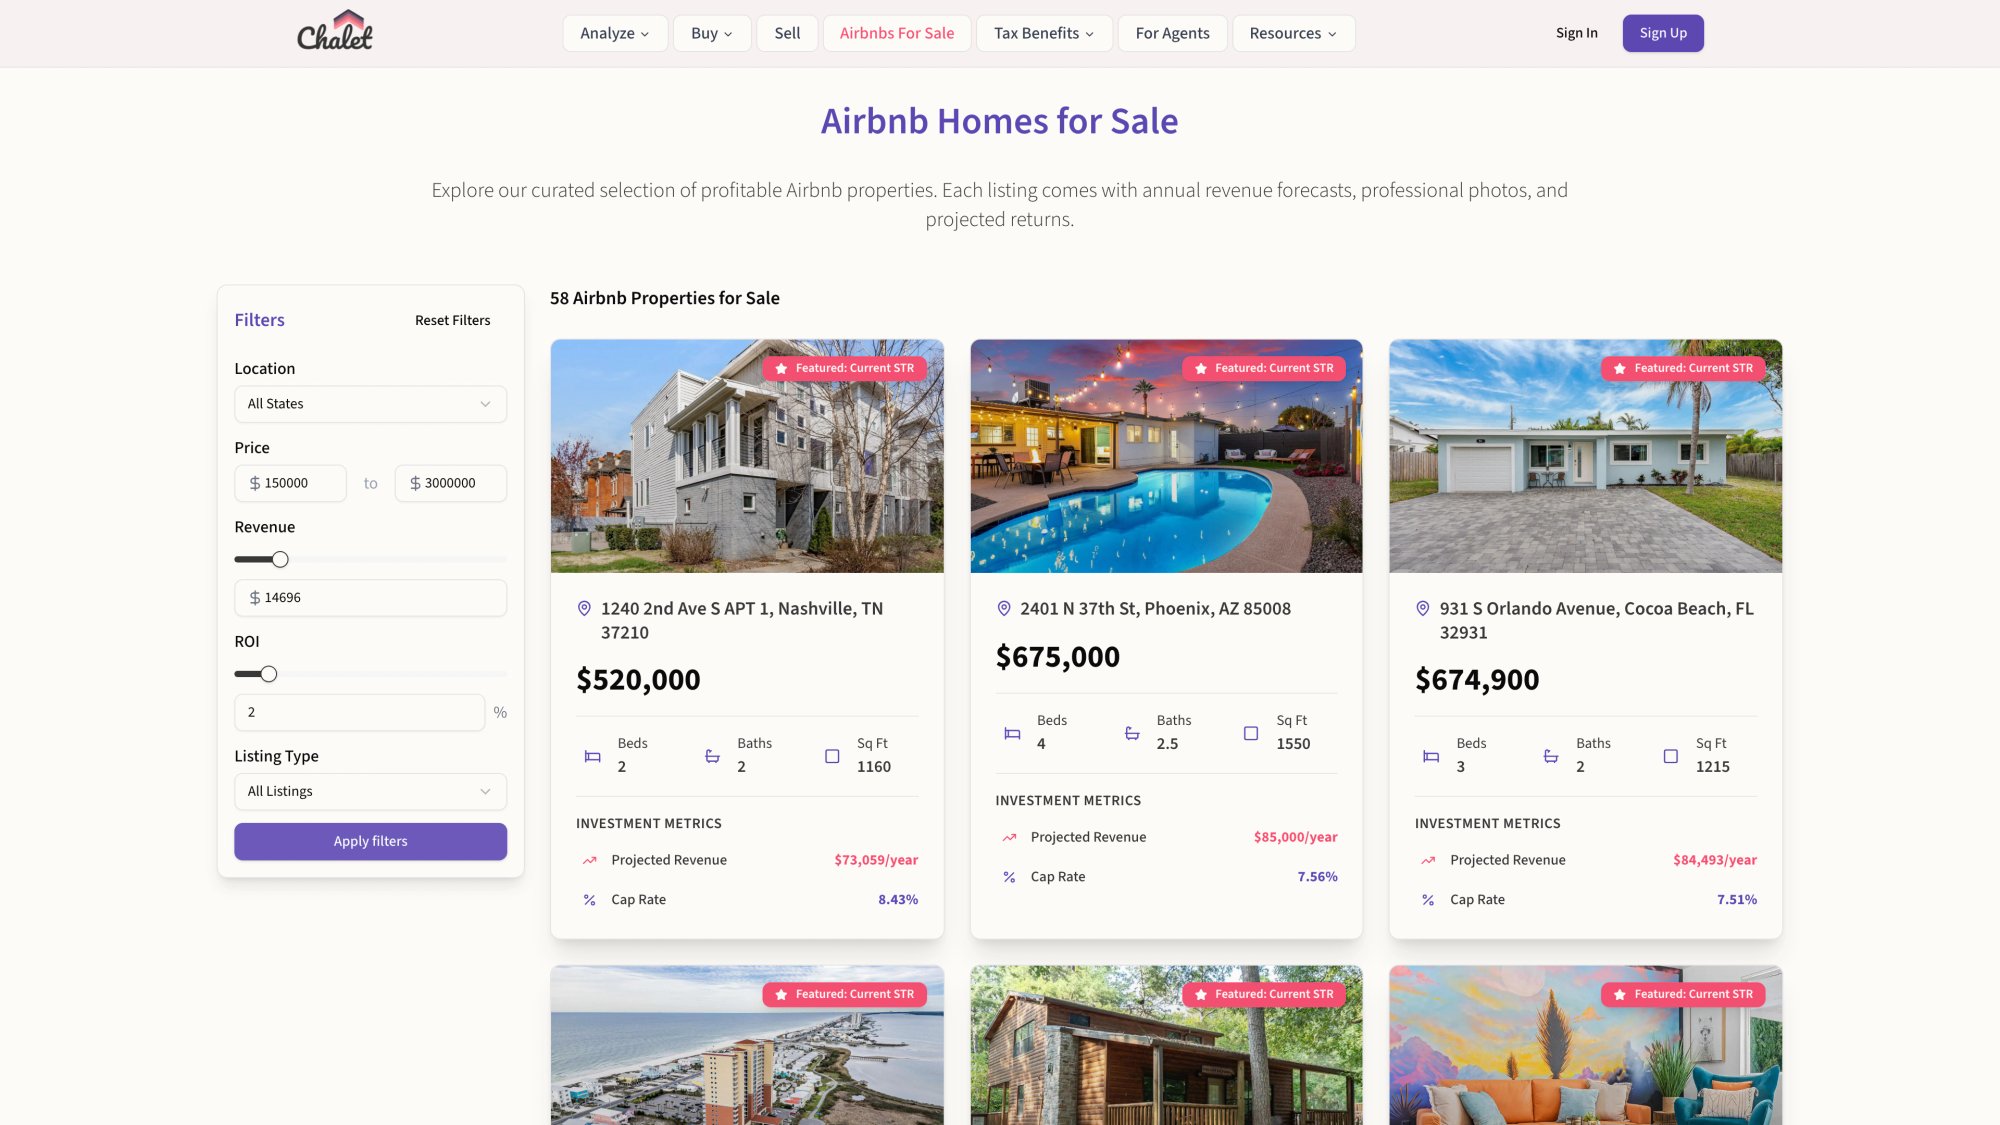
Browse Airbnb Rentals for Sale
Ready to browse? Our Airbnb rentals for sale page curates properties ideal for STR investment. See what's available in high-occupancy markets and get a sense of pricing and potential.
Frequently Asked Questions
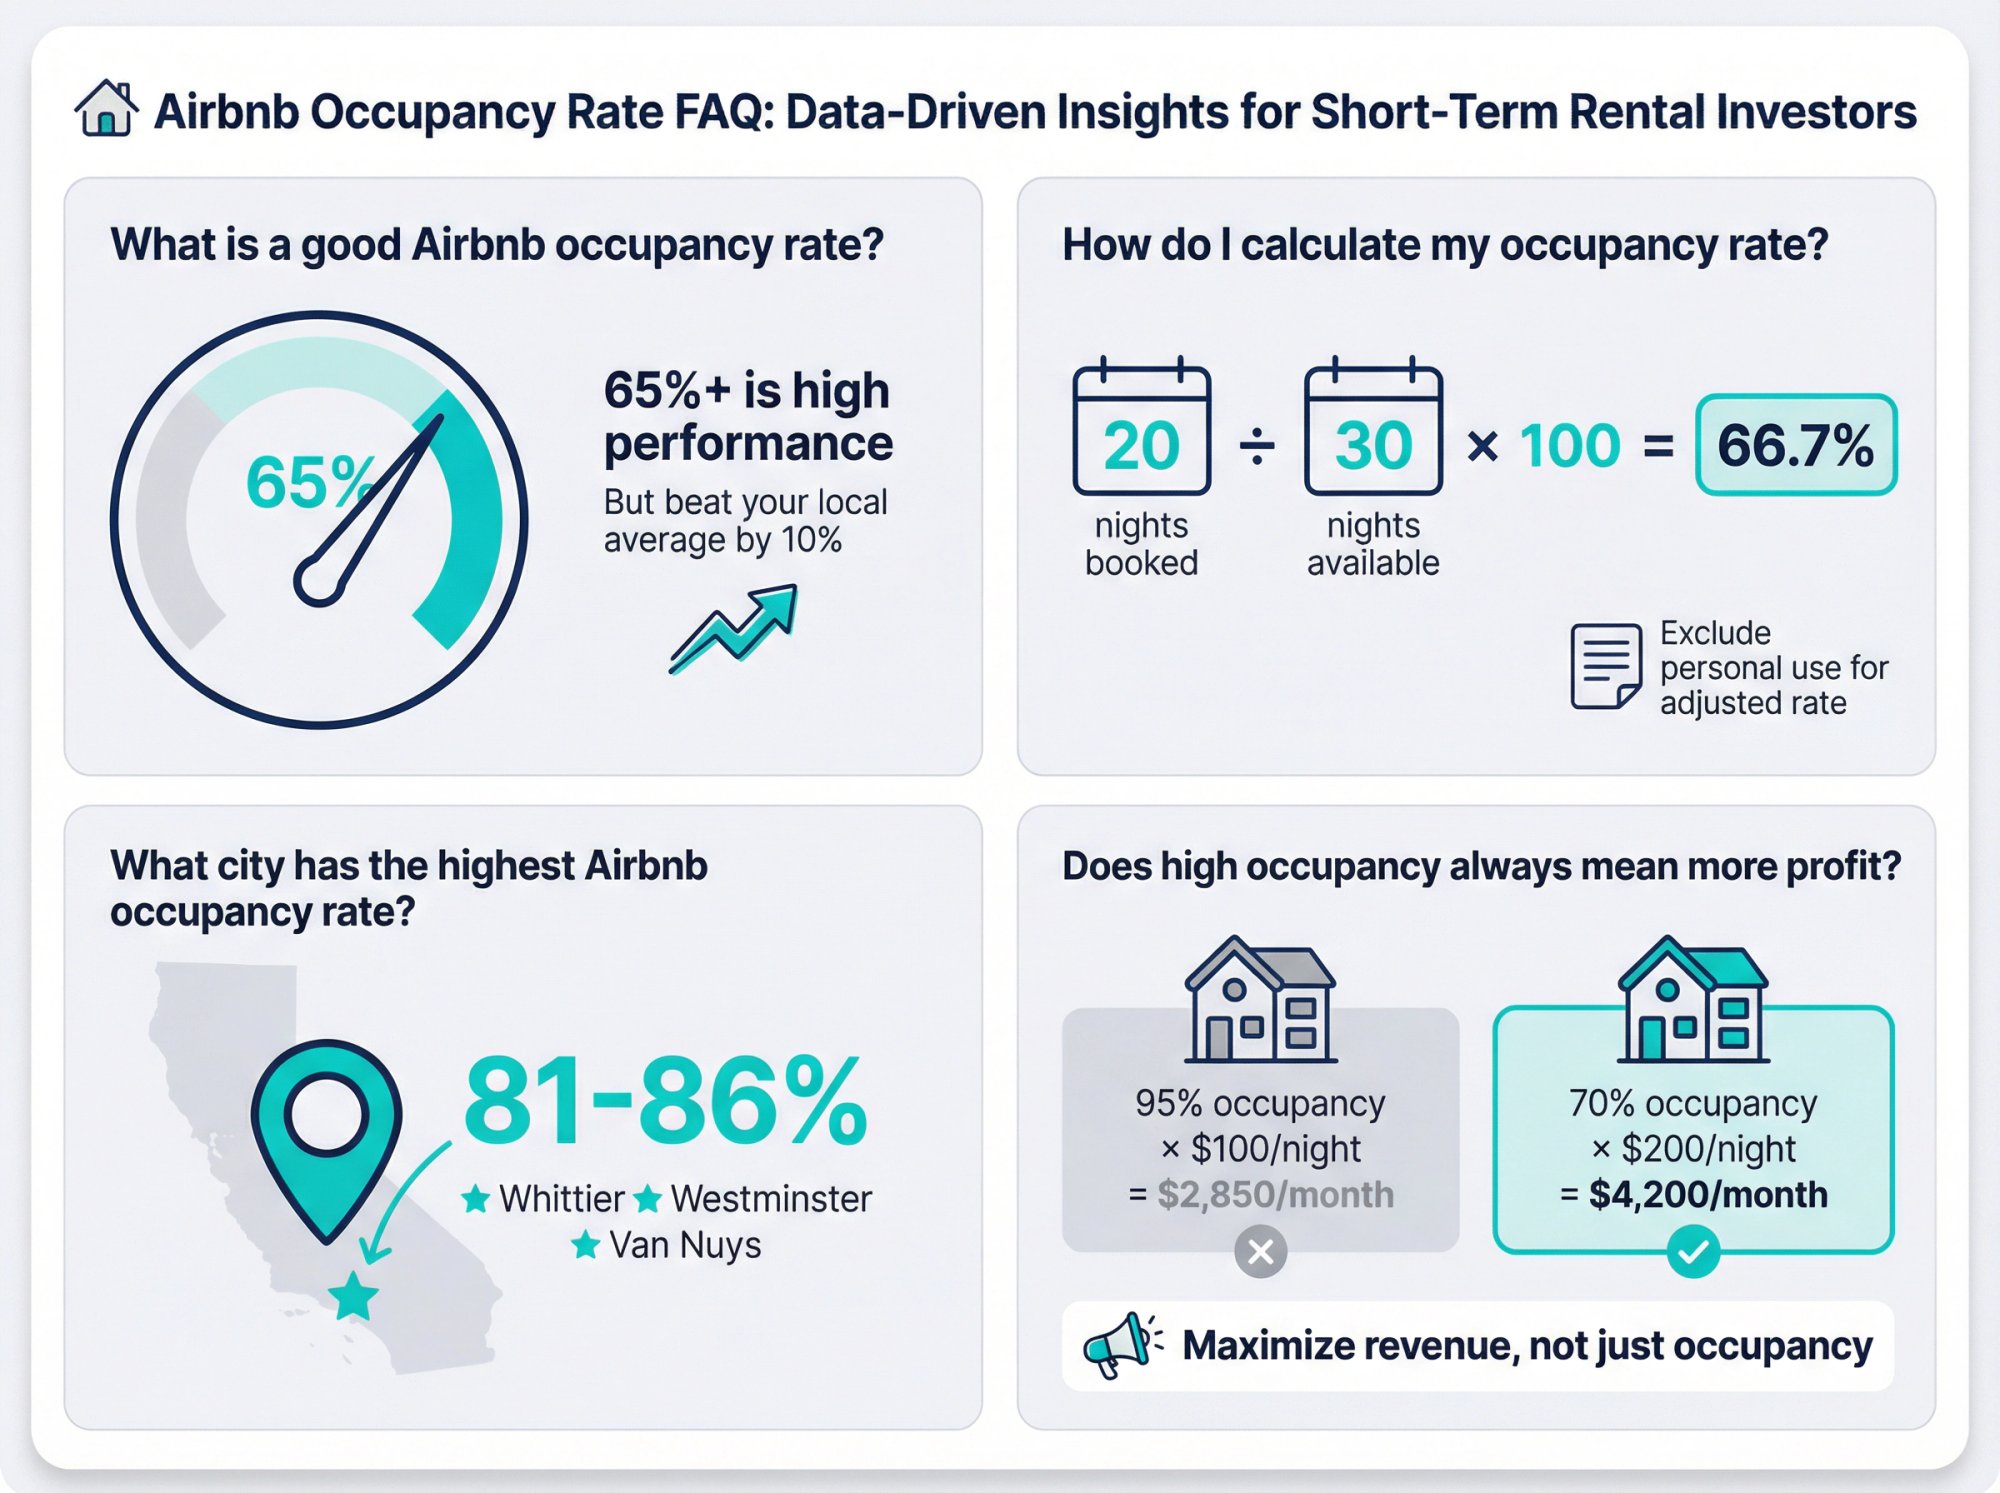
What is a good Airbnb occupancy rate?
A "good" occupancy rate typically means above 55%, with 65%+ considered high. But context matters. The real benchmark is your specific market's average. A property performing 10% above its local market average is doing well regardless of the absolute number.
How do I calculate my occupancy rate?
Divide the number of nights booked by the number of nights available, then multiply by 100. If you booked 20 nights out of 30 available, your occupancy rate is 66.7%. Some hosts also track "adjusted occupancy" which excludes dates blocked for personal use.
What city has the highest Airbnb occupancy rate?
As of 2025, several Southern California cities top the list with occupancy rates between 81-86%. These include Whittier, Westminster, Van Nuys, and other Los Angeles and Orange County suburbs. These markets benefit from consistent year-round demand and limited STR supply. View detailed stats in our California market analysis.
Does high occupancy always mean more profit?
Not necessarily. Running at 100% occupancy often means you've priced too low. The goal is maximizing total revenue, which usually means accepting somewhat lower occupancy in exchange for higher nightly rates. A property at 70% occupancy with $200/night rates earns more than one at 95% occupancy with $100/night rates.
How do regulations affect occupancy rates?
Dramatically. Cities that restrict short-term rentals to primary residences or cap permit numbers typically see higher occupancy for remaining legal listings (reduced supply with steady demand). New regulations can also cause occupancy to plummet as listings leave the market. Pacifica, CA saw occupancy drop from 76% to 21% in a single year after tightening rules.
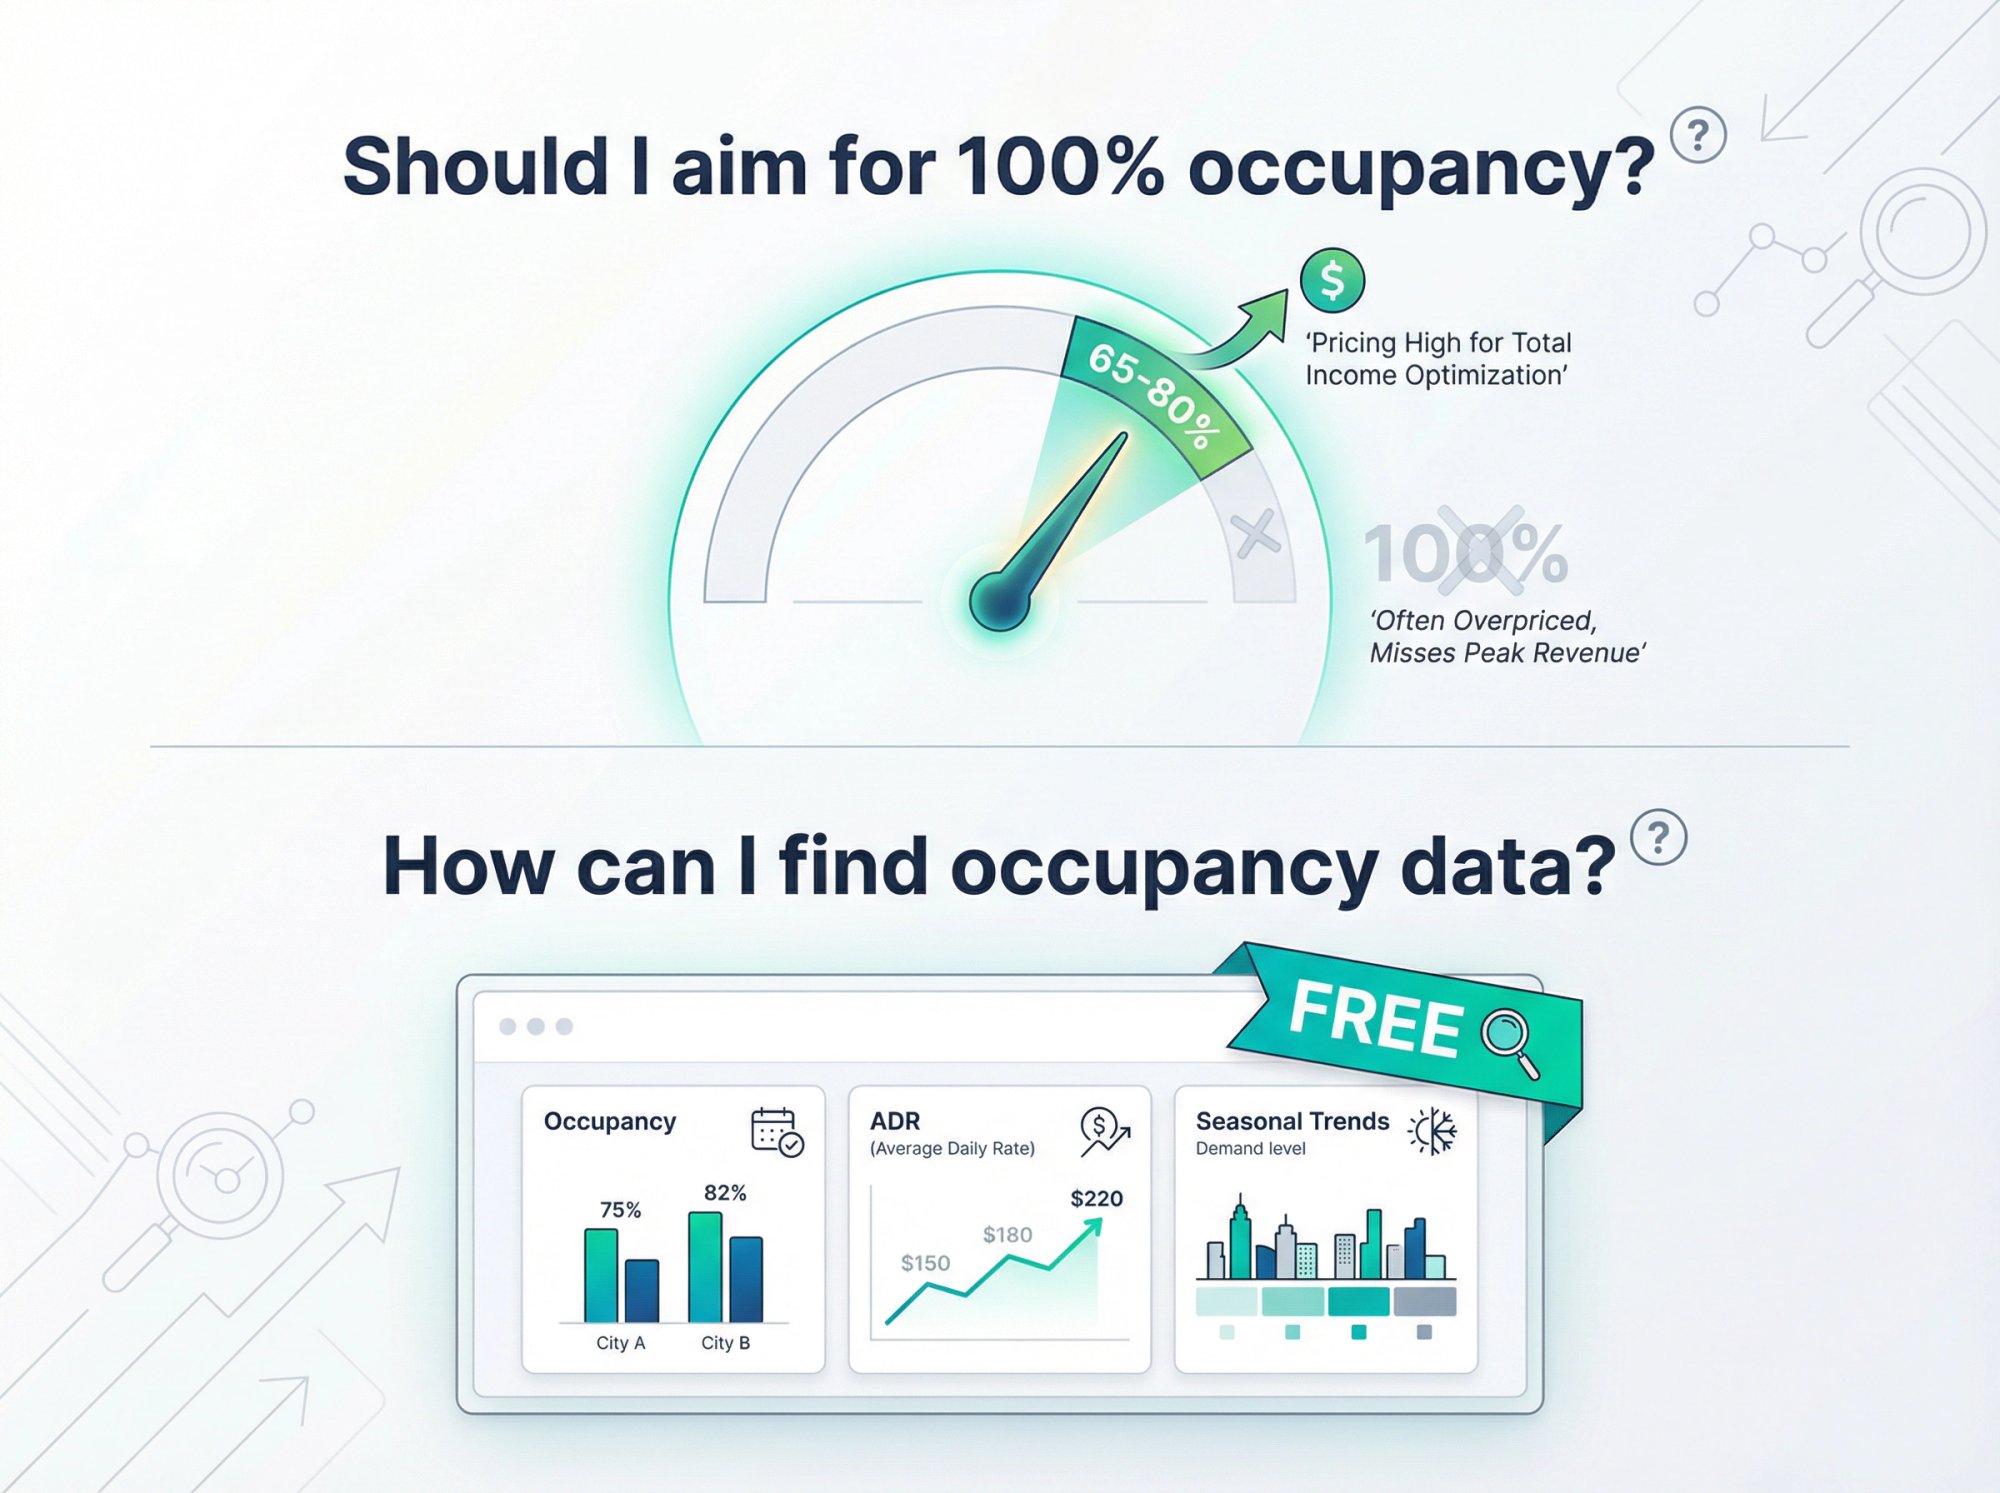
Should I aim for 100% occupancy?
Almost never. If you're fully booked all the time, you're leaving money on the table. Most revenue optimization strategies accept 65-80% occupancy in exchange for pricing high enough to maximize total income. The exception might be a brand-new listing building initial reviews where temporary lower pricing makes sense.
How can I find occupancy data for my target market?
Chalet's free market analytics provides occupancy, ADR, and revenue data for markets across the U.S. You can view seasonal trends and compare multiple cities without any subscription fees.
Start Using Occupancy Data for Smarter STR Investments

Understanding average Airbnb occupancy rates by city is foundational knowledge for any short-term rental investor. High-occupancy markets signal strong demand relative to supply. Low-occupancy markets require either seasonal strategies or careful analysis of what's driving the numbers down.
Use occupancy data to narrow your market search. Use local regulations to verify you can actually operate. Use Chalet's free tools to run projections on specific properties. Our must-read guide to investing in your first Airbnb rental walks through the complete process.
And when you're ready to take the next step, we can connect you with STR-specialist agents who know your target market inside and out. From research to ROI to execution, Chalet helps you move from occupancy data to actual investment decisions.
Explore free market analytics | Run ROI numbers on a specific address | Meet an Airbnb-friendly agent