Choosing the right Airbnb revenue calculator can make all the difference in planning a successful short-term rental investment. Airbnb calculator tools help hosts and investors estimate potential profits, analyze occupancy rates, and even gauge return on investment (ROI) for properties, while using real market data and AI insights.
Instead of guessing or manually crunching numbers (we will focus on the ability to also be able to manually adjust suggested and assumed numbers), these solutions automate the analysis by pulling information from millions of Airbnb (and often Vrbo) listings.
In this review, we compare several leading Airbnb income calculators to help you identify which one best fits your needs. We’ll cover each tool’s standout features and use cases. We will be using an actual Airbnb property in Fort Lauderdale to compare its actual performance with the projected numbers, with particular focus how they compare to the Chalet Free Airbnb Calculator.
Whether you’re evaluating a property to purchase or trying to maximize earnings on an existing rental, the following tools offer valuable insights into short-term rental performance. Each has its own strengths, from free basic estimators to more advanced analytics platforms. Let’s dive into the comparison of the top Airbnb calculator tools available for investors and hosts.
Rabbu Airbnb Calculator (launched 2023; free)
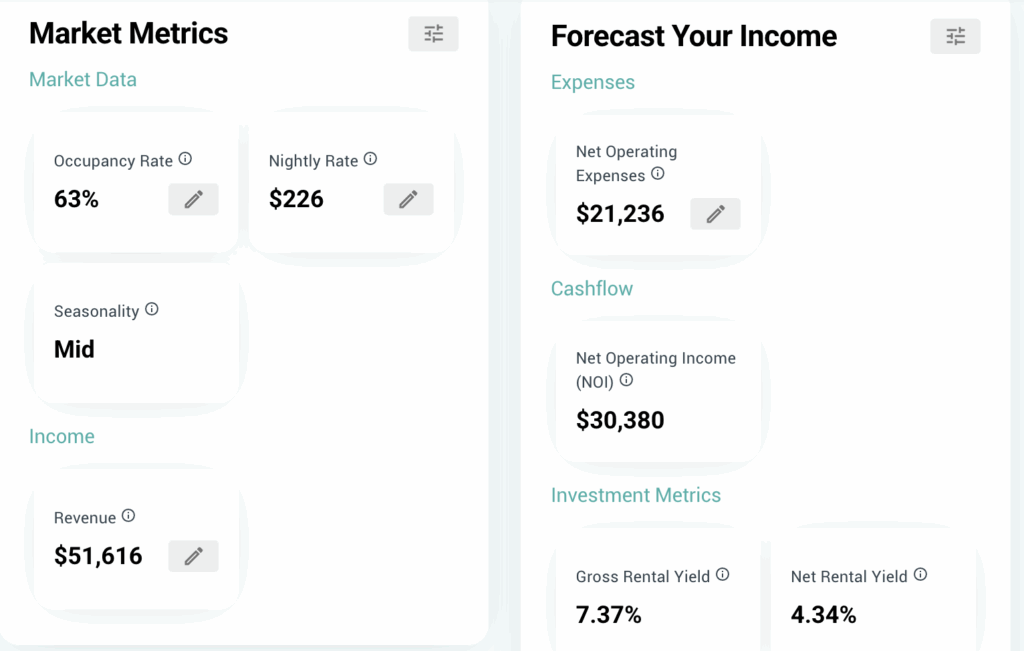
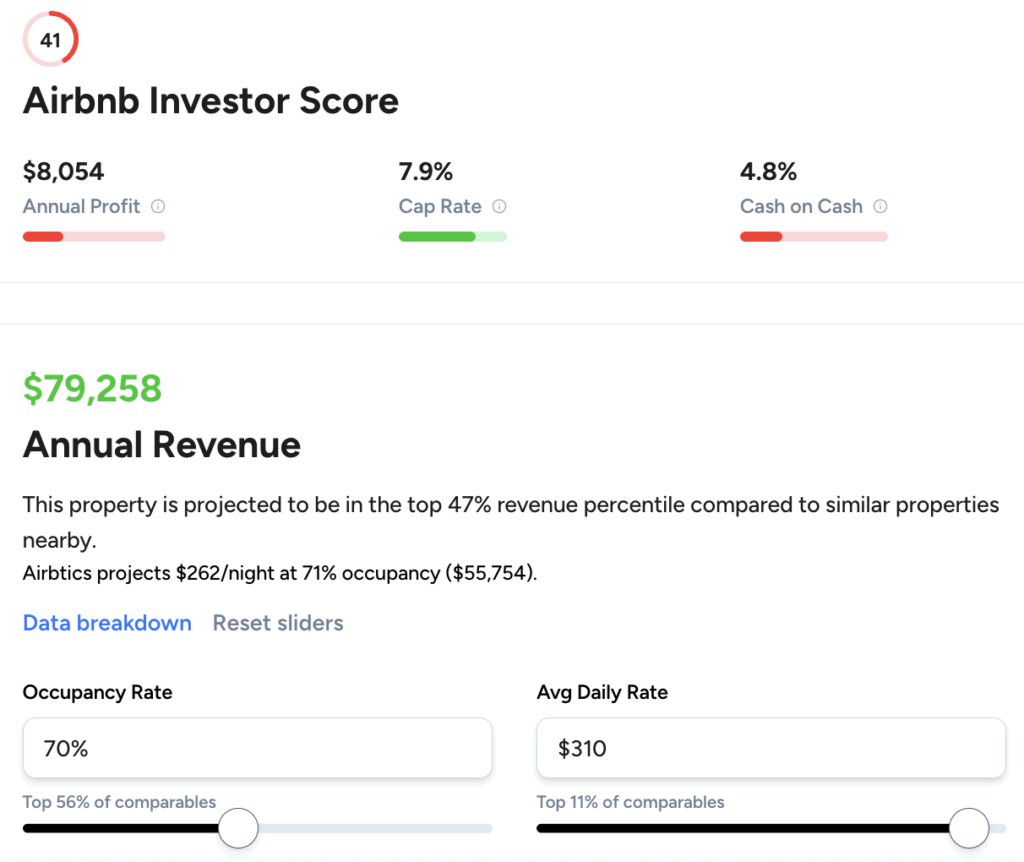
Rabbu’s Airbnb Calculator is a free (no account needed) and user-friendly tool that provides a quick projection of potential short-term rental revenue. It pulls from a large dataset of Airbnb listings and is designed to give investors a fast, top-line view of what a property might earn. The experience is streamlined: plug in an address and basic property details, and Rabbu returns a revenue estimate along with occupancy and ADR benchmarks.
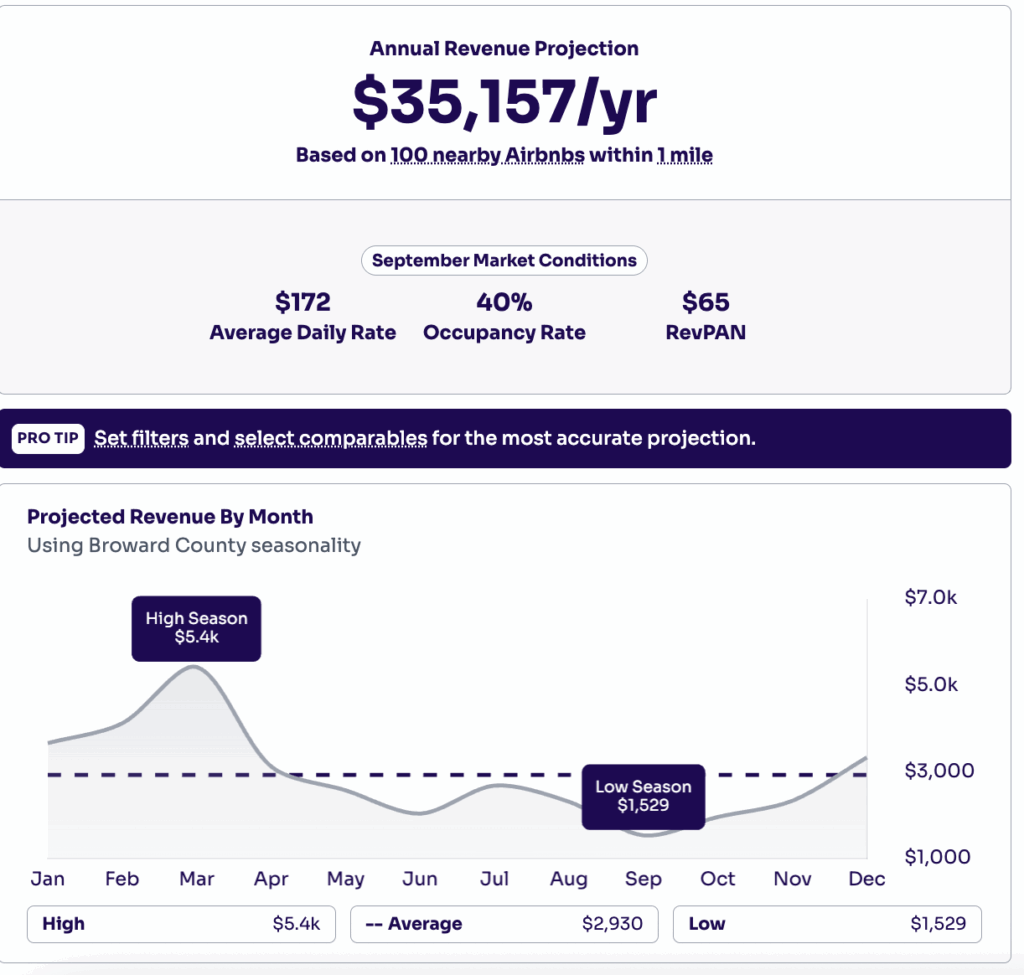
The main limitation is that Rabbu’s model relies heavily on market averages. This can make it less accurate for properties that perform significantly above (or below) average in their local market. For example, if a property has stronger demand, higher occupancy, or a premium nightly rate compared to the norm, Rabbu may understate its potential. This makes it useful for conservative baselines, but less reliable for property-specific underwriting.
Rabbu does include financing assumptions, and when factored in, it typically highlights that many deals are challenging to finance at today’s interest rates. In this respect, it points investors in the right direction, though the conservative baseline often exaggerates downside risk compared to tools that allow more granular adjustments.
Key Features
- Seasonality & trend adjustments at the market level.
- Simple, intuitive interface for quick estimates.
- Clear gross revenue breakdown (excludes many expense categories).
- U.S. market coverage only.
- No subscription required – completely free.
- Uses its own STR database Airbnb listings and comps.
Conclusion (with comparison)
| Metric | Actual Statements | Chalet (adjusted) | Rabbu Projection |
| Annual Revenue | ~$70,000 | ~$70,000 | $35,157 |
| Occupancy Rate | ~70% | 70% | 40% |
| ADR (Average Daily Rate) | ~$310 | $310 | $172 |
| Net Operating Income (NOI) | ~$39,000 | ~$39,000 | $20,029 |
| Cap Rate | ~5.6% | ~5.6% | 2.9% |
| Cash-on-Cash (all cash) | ~5.6% | ~5.6% | not shown |
| Cash-on-Cash (20% down, 7% loan) | negative (≈ -$8k to -$12k/yr) | negative (calculator shows ~-1%) | -15% |
Rabbu works well for a quick, no-cost snapshot and is especially appealing for beginners exploring potential markets. However, its reliance on market averages means it may undervalue higher-performing properties. The actual property manager statements and Chalet’s adjusted model are closely aligned, both showing around $70k in gross revenue, $39k in NOI, and a 5.6% cap rate. Rabbu’s projection comes in far lower, at roughly half the real revenue and NOI. With financing at today’s interest rates, returns are negative in both Chalet and Rabbu, although Rabbu exaggerates the losses because it underestimates revenue.
AirDNA Rentalizer (launched 2021; $34-$50/mo)
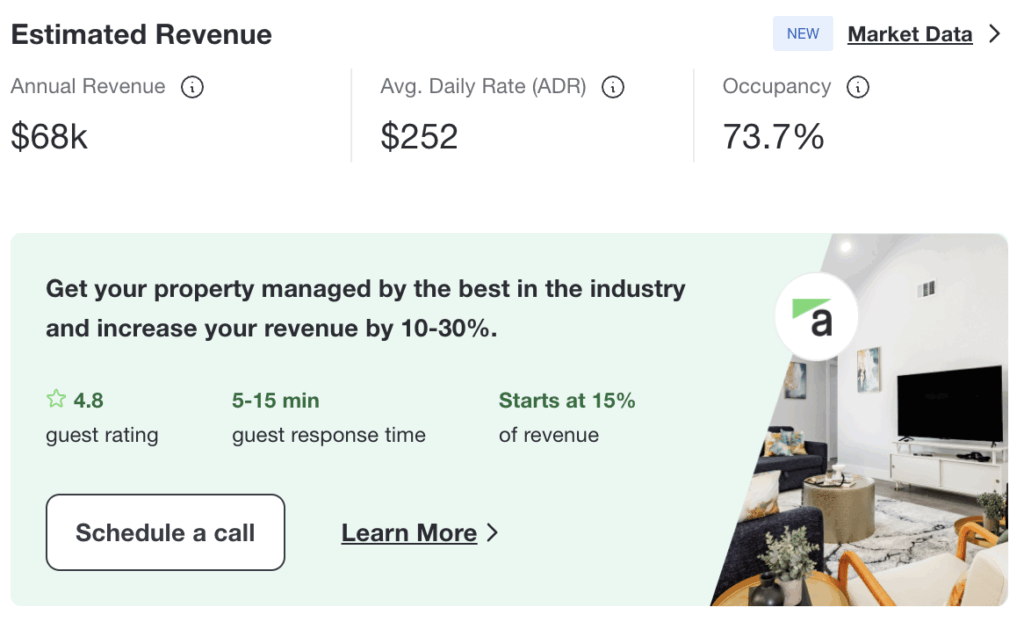
AirDNA Rentalizer is a widely used Airbnb calculator (requires you to create an account/register; has optional paid upgrades) designed to help hosts and real estate investors evaluate short-term rental income potential. AirDNA’s tool leverages a large database of over 10 million Airbnb and Vrbo listings worldwide. By entering a property address and a few details (number of bedrooms, guest capacity, property type), it generates a projection of expected annual revenue, occupancy rate, and average daily rate (ADR).
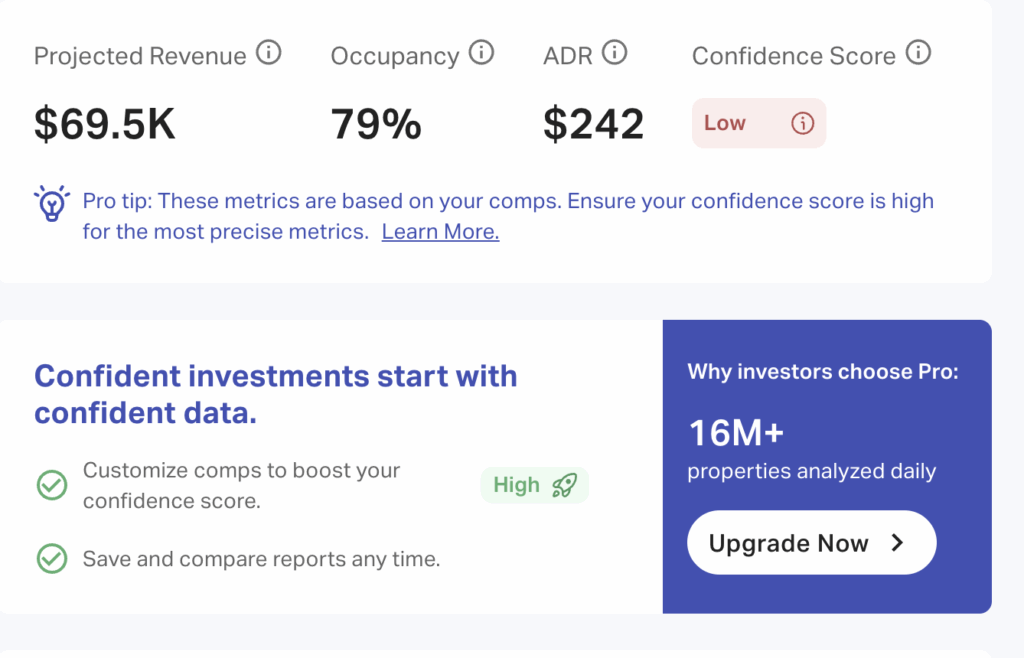
One of Rentalizer’s strengths is its ability to benchmark a property against nearby competition and seasonality trends, offering a market-level view of income potential. However, its projections often differ from real performance: for example, it may show higher occupancy with lower ADR to arrive at the same annual revenue. That makes it a useful snapshot tool but less precise when compared to property-specific statements or adjusted calculators like Chalet.
AirDNA is free for basic revenue estimates, while more advanced features (such as monthly revenue forecasts, comparable property sets, and amenity-based comparisons) require a paid subscription.
Key features:
- Customizable revenue projections based on property details and user adjustments
- Market benchmarking against comparable rentals in the area
- Clear visuals for revenue, ADR, and occupancy projections
- Competitive analysis of nearby listings and seasonality trends
Free baseline results, with paid upgrades unlocking comps, monthly projections, and amenity breakdowns
Conclusion (with comparison)
| Metric | Actual Statements | Chalet (adjusted) | AirDNA (adjusted) |
| Annual Revenue | ~$70,000 | ~$70,000 | $69,500 |
| Occupancy Rate | ~70% | 70% | 79% |
| ADR (Average Daily Rate) | ~$310 | $310 | $242 |
| Operating Expenses | ~$31,000 | ~$30,600 | $28,200 |
| NOI (Net Operating Income) | ~$39,000 | ~$39,000 | $41,300 |
| Cap Rate | ~5.6% | 5.6–6% | 7.3% |
AirDNA matches total revenue at about $70k, but it does so by assuming a higher occupancy rate of 79% and a lower ADR of $242. Its cap rate initially appeared higher because it used a lower purchase price of around $567k. When the purchase price is corrected to $700k, the cap rate falls in line with Chalet and the actual results at roughly 5.6%.
Both Chalet and AirDNA assume similar expense levels, though Chalet breaks them down more in line with how operators actually incur them. For investors, Chalet provides property-specific accuracy, while AirDNA offers market-level context (helpful for comps and seasonality, but less exact for a specific property).
These conclusions seem to be in line with the reviews we also discovered on Reddit–here are a few threads we analyzed: Thread 1 and Thread 2.
The general sentiment is as follows: AirDNA and its Rentalizer tool are helpful for getting a broad sense of market trends, seasonality, and revenue potential, but users say the numbers are often optimistic or inflated. They work best as a starting point, not a final forecast. The general advice is to cross-check with real comps, adjust downward to stay conservative, and remember that actual performance depends heavily on property quality, amenities, and management. Many hosts also shared negative feedback, noting consistent overestimates, misinterpreted occupancy data, and limited reliability in slower seasons or weaker markets.