Chalet Logo
Trusted by 10,000+ STR investors

Free Airbnb Calculator for Short-Term Rental Investments

Get investment analysis for any U.S. address: revenue, ROI, occupancy, and projections.

Start by searching an address, then choose bedrooms and bathrooms to match your unit before running the analysis.

More tools for STR investors

Get Comprehensive Airbnb Rental Investment Analysis in Seconds

Our Airbnb Calculator—also called a Short-Term Rental Calculator or STR Calculator—helps investors and hosts estimate revenue, ROI, and market potential for any property in the U.S., with projections, market insights, and investment metrics.

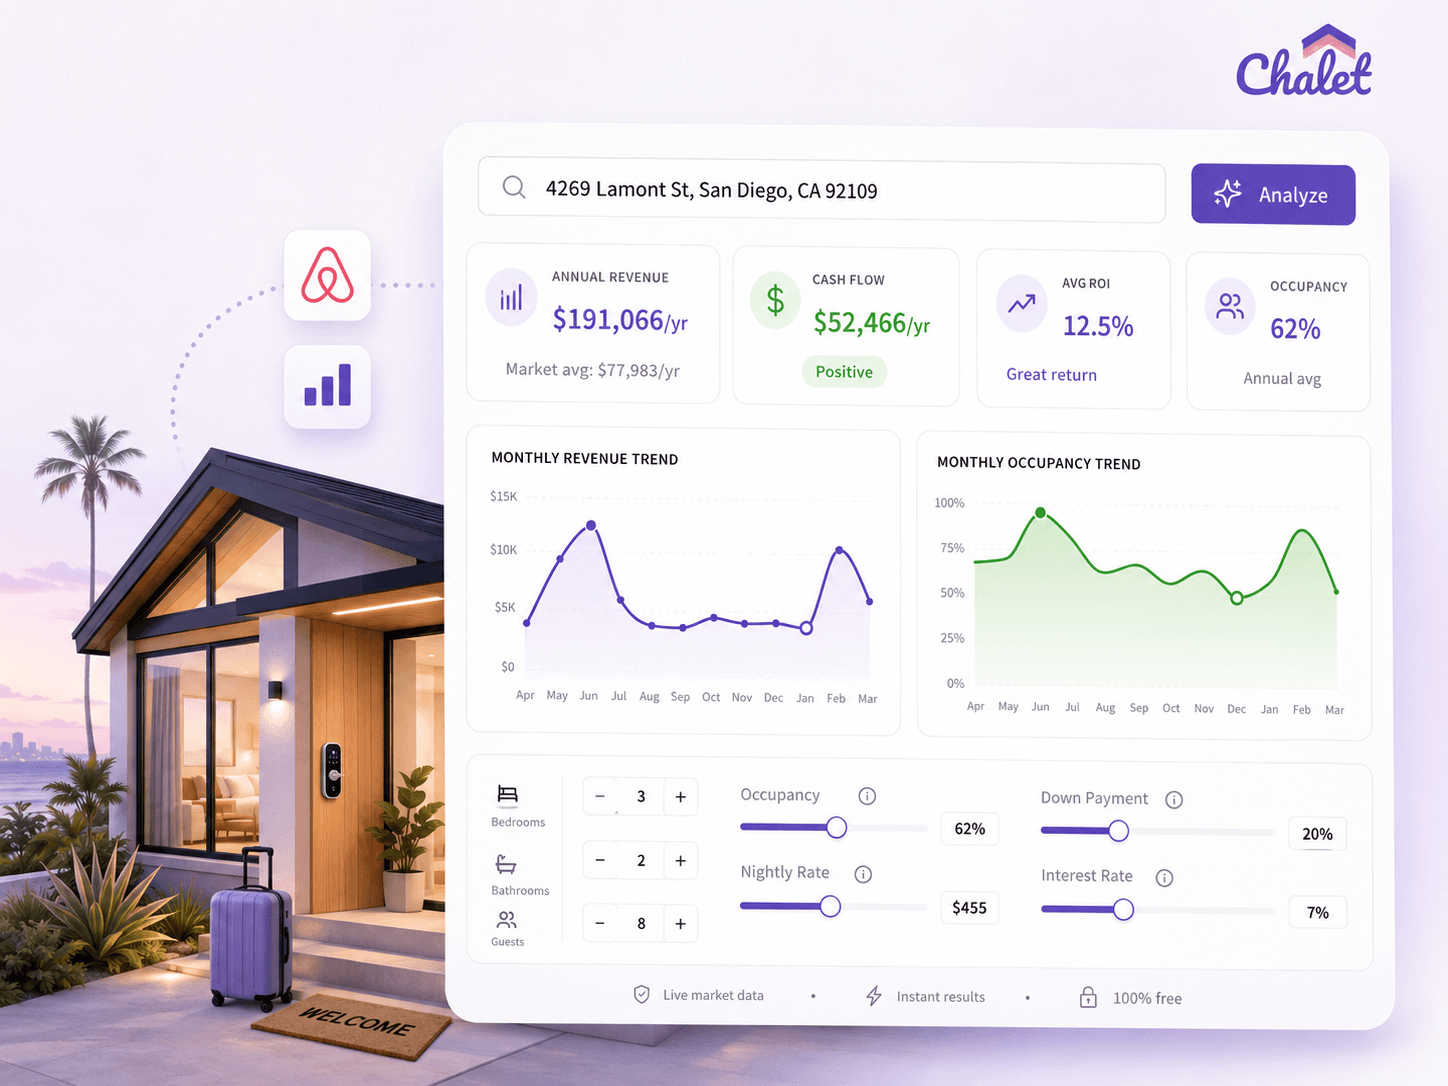
Instant Airbnb Rental ROI Analysis

Get cap rates, cash-on-cash returns, and profit projections instantly

Market Insights

Compare with similar properties and understand local market trends

Future Projections

See 10-year investment value growth and appreciation forecasts

Key Metrics You'll Get

Here's a preview of the comprehensive financial analysis you'll receive for any property

Enter an Address Above

to see real data for your property

Market Estimates

Historical performance based on comparable listings and past occupancy trends.

Annual Revenue
$82,456
Occupancy Rate
65%
Average Daily Rate
$12

Calculated Projections

Calculated from your financial Assumptions. Edit above to see how the results change.

Cap Rate
4.2%
Cash on Cash
9%
Net Income
$42,156

Visual Analytics & Insights

Interactive charts and data visualizations for better decision making

Airbnb Rental Revenue Per Month
Estimated gross rental income by month from short-term bookings. Based on comparable listings and local demand—seasonality and events can shift results.
$51,100Annual revenue (12 mo)

Average monthly revenue: $4,258/mo — typical income per month over the year.

Peak month: Jun ($5,800) — your highest-earning month; plan for seasonality in cash flow.

Estimated Investment Value
How your total investment value grows over 10 years: cumulative equity (principal paid down), home appreciation, and net rental cash flow. Assumptions are editable on the full report.
$270,000Projected value at year 10157.1% total growth vs. today

Stack breakdown: Each bar shows equity (ownership built), appreciation (market value gain), and net cash flow (rental income after expenses). Combined = total investment value.

Value over time: Starting at $105,000 today → $270,000 in year 10 (projected).

Everything You Need for Smart Investment Decisions

Our comprehensive analysis covers all aspects of short-term rental investing

Revenue Projections

Monthly and annual revenue estimates based on local market data and comparable properties

Comparable Properties

Detailed analysis of similar properties in your area with performance metrics and pricing data

Financial Assumptions

Customizable expense categories and investment parameters for accurate ROI calculations

Market Insights

Local market trends, seasonality patterns, and competitive landscape analysis

Investment Metrics

Cap rates, cash-on-cash returns, net income, and other key performance indicators

Growth Projections

10-year investment value forecasts including appreciation and equity building

Ready to Analyze Your First Property?

Enter any address above to get instant access to comprehensive investment analysis and start making data-driven decisions today.

100% Free • No Registration Required • Instant Results

Homepage hero image