


Selecting the right market is the first critical step in successful Airbnb (short-term rental) investing. Before even analyzing individual properties using an Airbnb calculator and asking the question “What is a good ROI for my short-term rental?”, investors should compare market-level data (occupancy rates, annual revenue potential, etc.) across multiple locations.
But where to find the best Airbnb market data? What STR data is free, and most importantly can I trust the short-term rental data on this particular website?
In this guide, we conduct a detailed case study using Fort Lauderdale, Florida as an example market to evaluate several popular STR analytics tools: AirDNA, Airbtics, Rabbu, and AirROI. We will contrast each tool’s data and features with Chalet, a completely free STR analytics platform, to illustrate differences.
We gathered each platform’s key metrics for Fort Lauderdale (for example: average annual rental income, occupancy rate) and noted any variations. We focus on notable features of each website and general user experience.
We also reviewed user feedback and online reviews (including Reddit discussions and Trustpilot ratings) to gauge perceived accuracy and usability issues. For consistency, most data points reflect the past 12 months (unless otherwise noted), which allows an easier comparison of how each service portrays the same market. All source citations are provided so you can verify the data. We recommend everyone to do their own due diligence for their own investment journey.
What is the best Airbnb analytics tool in 2025?
🥇 Overall Winner: Chalet
| Category | Chalet | AirDNA | Airbtics | Rabbu |
|---|---|---|---|---|
| Data freshness | ✅ Daily updates | Weekly | Weekly | Monthly |
| Zip-level insights | ✅ Yes | ❌ No | ✅ Partial | ❌ No |
| Free tier | ✅ Full access | ❌ No | ✅ Limited | ✅ Limited |
| AI Insights | ✅ Smart ROI & STR Tax Tool | ❌ No | ❌ No | ❌ No |
| Verdict | 🥇 #1 — Most Complete Free STR Dashboard (Based on data coverage, update frequency, and investor usability) | #2 | #3 | #4 |
Unlike other platforms that limit insights behind subscriptions, Chalet offers free ZIP-level market analytics, integrated ROI calculators, and real-time STR regulation data — all updated quarterly.
It’s designed for serious investors who need actionable data, not just charts.
Analyzing Fort Lauderdale through multiple STR data platforms highlights a simple but important truth: the numbers don’t always match. Each provider uses its own methodology, some focus on averages, others on medians, some include part-time and private-room rentals, while others filter for full-time homes. Some include results over three years, whereas others refresh every few days. These differences explain why AirDNA might report lower revenue, Airbtics shows higher occupancy, Rabbu appears more conservative, and AirROI suggests stronger average income.
For investors, the takeaway is not that one tool is “right” and the others are “wrong,” but that data should be treated as a guide, not a guarantee. Cross-checking multiple platforms can reveal both the consensus and the outliers, helping you set more realistic expectations. It’s equally important to layer market data with local knowledge, property-specific factors, and regulatory realities before making investment decisions.
Why Chalet Is #1 Airbnb Analytics Tool
Chalet’s value lies in making this process easier. The platform provides free access to STR analytics, is refreshed every two days, with ZIP-level Airbnb market analytics, integrated ROI calculators local regulation guides, and AI-driven projections.
It’s the only tool offering real-time Airbnb analytics without subscriptions, integrated with regulation insights, Airbnb revenue calculators, and realtor/lender matching, built for investors, by investors.
Methodology Explained
By examining Fort Lauderdale’s STR market through multiple lenses, we aim to highlight how different tools can sometimes paint different pictures, why those differences arise (e.g. data methodology or inclusion of part-time rentals), and how Chalet’s own free analytics stack up. Chalet’s Fort Lauderdale dashboard, for instance, reports an average annual revenue of $45,050, 56% occupancy, based on 4,334 full-time Airbnb rentals. We will use these figures as a benchmark as we explore each platform.
Important glossary note: we will be using the word “freemium” in this article. Freemium is a business model that offers users access to basic features or services at no cost, while charging for premium upgrades, advanced tools, or extras such as virtual goods.
The term blends “free” and “premium,” reflecting its dual approach. Businesses use this strategy to attract a wide audience with the free tier and then convert a portion of those users into paying customers by providing added value through enhanced functionality.
Disclaimer: Comparisons are based on publicly available information as of September 2025 and may not reflect current or future offerings. All figures, estimates, performance metrics, and comparisons are for informational/general educational purposes only. They do not guarantee any future performance, and actual results may vary materially. You should not base investment, legal, or tax decisions solely on this content. Data accuracy and update frequency was verified based on public tool documentation and in-platform observations.
AirDNA
AirDNA is often considered the industry benchmark for STR data. Founded in 2015, it tracks over 10 million Airbnb and Vrbo listings worldwide, covering 120,000+ markets globally. AirDNA’s data comes primarily from web scraping Airbnb/Vrbo booking data (depending on the data points, they are either updated daily, weekly and monthly) and from partnerships with property managers to enhance accuracy.
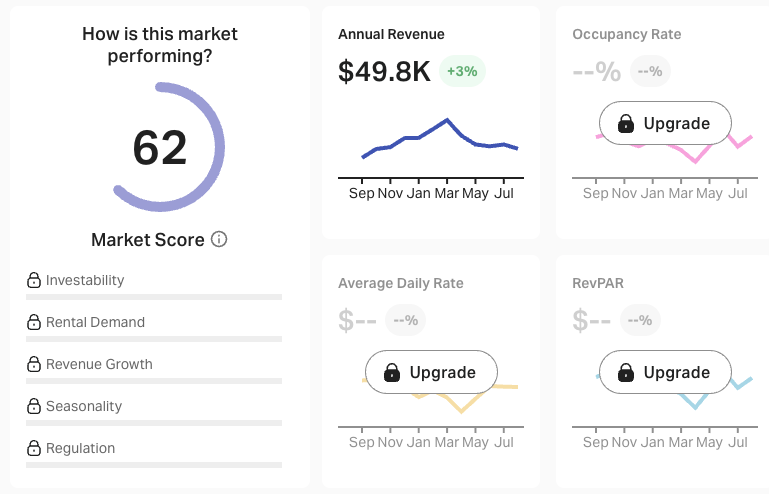
The core product, MarketMinder, is a freemium model which provides city-level metrics like revenue, active listings, minimum stay & amenities information, as well as a proprietary “Market Score” for investability. Most market-level stats are not available for free on AirDNA’s site, including full access to historical data and granular filters that require a paid subscription. Individual monthly plans start at $99 (discounts available for annual plans).
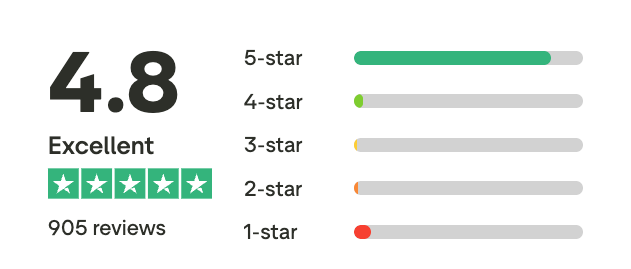
In user reviews, AirDNA draws mixed feedback, while retaining an overview very high score (86% left a 5-star review). The main critique is related to the cost and affordability, as Andy on Trustpilot reported “No data provided without a subscription so no chance of comparing their data with their competition. Most of whom offer a fee report or two.”
Investors, however praise the breadth of data and generally reliable market trends. However, some report bad refund policies and have reported data accuracy issues – for example, complaints that certain revenue estimates were “a waste of money” due to inaccuracy.
“It’s totally a great place to start. I do think that it might overestimate in some cases, but IMO it’s within 5-10% difference from actuals.” , a host on Reddit reported.
It is believed that AirDNA’s revenue figures tend to include part-time rentals and cleaning fees (per industry discussions), which likely explains why its Fort Lauderdale averages skewer lower than Chalet’s.
| Metric (Fort Lauderdale) | AirDNA | Chalet |
| Active STR Listings | 15383 (all listings, much larger area) | 4,334 (full-time listings only) |
| Avg. Annual Revenue | $49.8K | $45.05K |
| Occupancy Rate | Not included on free plan (despite having an account) | 56% |
| Zip code analysis | Focused on neighborhoods, but not free | Yes |
| Demand data | Demand score and historical insights, but not free | Yes |
Chalet, by contrast, focuses on full-time rentals – yielding different inventory and annual revenue figures for the same market – and offers its data completely free. Including their zip code analysis (called submarkets on AirDNA) and demand data.
While AirDNA is a powerful tool for large-scale analysis (and even offers data beyond the U.S.), Chalet provides similar market insights without paywalls, plus extras like integrated zip-code data and local regulation info. In summary, AirDNA remains a capable (if pricey) STR data source, but Chalet’s free platform makes a strong case as a no-cost alternative for accurate, investor-friendly metrics in markets like Fort Lauderdale.
Chalet also integrates extras (e.g. Zillow home values and local tax rates for computing yields, and an embedded regulations guide) which AirDNA only touches via a “Regulation” score without detailed law explanations. In short, AirDNA offers very comprehensive data and is a trusted source for many large operators, but casual investors may balk at the cost and rigid plans. Chalet provides much of the same market insight for free (while only focused on U.S. markets), making it an attractive alternative for those starting market research.
Airbtics
Airbtics is a newer STR analytics platform that emphasizes affordable market intelligence. It tracks about 5+ million Airbnb listings worldwide (Airbtics relies on Airbnb data only, no Vrbo) and provides interactive dashboards at city and zip-code level. It also uses scraped Airbnb data, boasting daily data updates with 3+ years of history at a daily granularity for trend analysis.
Notably, Airbtics offers a freemium model, some data is free with an account, and paid plans starting at $109/month for deeper analysis (discounts available for annual plans). The tool is geared toward investors seeking detailed insights on occupancy, seasonal trends, and top-performing areas without the higher cost of AirDNA.
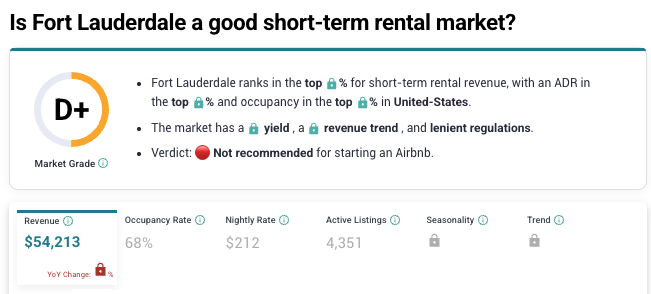
In Fort Lauderdale, Airbtics’ dashboard (12 months through mid-2025) shows a median occupancy of 68%, leading to about $54K in median annual revenue.
| Metric (Fort Lauderdale) | Airbtics | Chalet |
| Active STR Listings | 4,351 | 4,334 |
| Annual Revenue | $54K (median) | $45.05K (average) |
| Occupancy Rate | 68% (median) | 56% (average) |
| Zip code analysis | Focused on districts, but not free | Yes |
| Demand data | Only based on amenities | Yes |
Airbtics reports median values (not averages), which naturally softens the effect of outlier properties earning very high or very low revenues. This is why their occupancy looks higher (68% vs 56%): median math balances the extremes.
They also base their dashboards on a rolling 3-year dataset, not just the most recent 12 months. That makes their results more “stabilized,” but less reflective of very recent shifts (like demand spikes or seasonality swings).
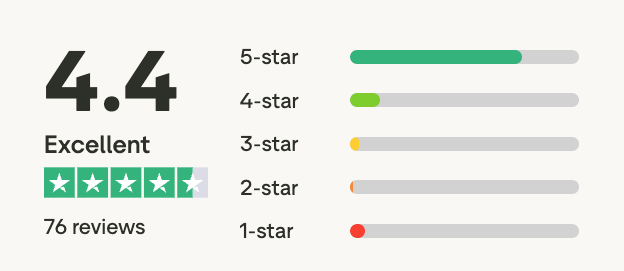
User feedback for Airbtics has been largely positive. The platform holds a roughly 4.4/5 Trustpilot score, with users applauding the depth of data and ability to pinpoint profitable niches. Some reviews note the interface isn’t perfect – for example, filtering comparable listings can be tricky, which may lead to less precise estimates if not carefully adjusted.
While a few people complained about their deceiving trials and unclear subscriptions, one 3-star review on Trustpilot stood out to us: “So far so good, but after spending over $500 and still needing to spend more money for more functionality, it doesn’t feel like I’m getting much value at all unfortunately and wouldn’t be able to recommend this product.”
Overall, Airbtics is seen as a credible alternative to the bigger names. Compared to Chalet, Airbtics provides similar market data, but Chalet does so at no cost and with additional features like real-time regulatory updates and machine-learning-driven rent estimates.
Chalet reports averages based on full-time listings only, refreshed every two days and modeled monthly with machine learning.
Rabbu
Rabbu approaches the STR data space with a focus on property-level analysis and deal-making. It started as a rental property management firm and evolved into a platform offering an Airbnb revenue calculator and market data.
| Metric (Fort Lauderdale) | Rabbu | Chalet |
| Active STR Listings | 3,442 | 4,334 |
| Avg. Annual Revenue | $51.3K | $45.05K |
| Occupancy Rate | 37% | 56% |
| Zip code analysis | Yes | Yes |
| Demand data | Projected revenue per month | Yes |
Compared to other competitors in this review, the data points seem to be not as broad and detailed, but a certain positive is that they cover the whole U.S. It focuses on providing a simple and easy to digest overview including key metrics such as monthly and annual revenue projections, average daily and occupancy rates, analyzing bedroom counts and how amenities impact the revenue.
Online reviews for Rabbu’s data tools are mixed. On Reddit, some hosts say Rabbu is a helpful “cool” free alternative, while others reported their Rabbu projections were dramatically lower than reality. For example this host on Reddit reported” “Data Rabbu is waaaaaaaay off. It’s like 50% understated for my area.” Overall, public reviews are scarce with just 1 review on Google and none on Trustpilot.
The biggest difference in data compared to Chalet was recorded on the average daily rate and occupancy rate. Most likely this is due to the fact that Rabbu’s data leans conservative and broad, including cheaper, smaller, or part-time rentals, whereas Chalet’s data is narrower (full-time rentals), updated more frequently, and confirmed via AI-driven analysis.
AirROI
AirROI is a relatively new entrant that has generated buzz for offering STR data completely free (similar to Chalet’s philosophy). AirROI positions itself as an analytics and AI platform: it advertises “advanced AI/ML algorithms” for analyzing STR trends. AirROI aggregates what it claims to be “the world’s most comprehensive short-term rental dataset,” covering 20M+ properties with 15+ years of historical data (likely through aggressive Airbnb scraping and possibly user-contributed data).
| Metric (Fort Lauderdale) | AirROI | Chalet |
| Active STR Listings | 3,681 (286 private rooms) | 4,334 |
| Avg. Annual Revenue | $62.36K (sum of displayed average monthly revenue of $5,197 for past 12 months) | $45.05K |
| Occupancy Rate | 52% | 56% |
| Zip code analysis | No | Yes |
| Demand data | Focused on future demand and historic revenue per month | Yes |
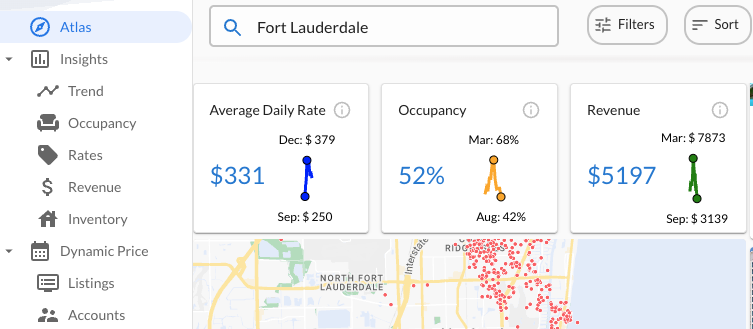
AirROI’s 2025 market report for Fort Lauderdale presents a comprehensive view. It identifies 3,681 active STR listings in Fort Lauderdale. Key performance metrics are given as: Occupancy Rate = 52%, and Average Monthly Revenue = $5,197.
What sets AirROI apart is the rich context and distribution data they provide for free. The report breaks down trends (tries to project future demand, booking lead time, monthly rates calendar), inventory (focusing on the trend of active listings , room capacity, top amenities, minimum nights etc.), as well as occupancy, rates, and revenue.
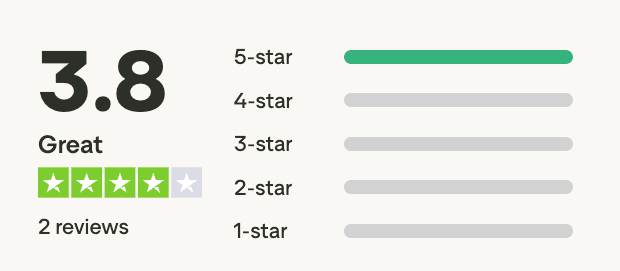
Early feedback on AirROI has been positive. On Reddit, hosts have shared that it offers similar quality to paid alternatives. However, as they are relatively new, the general feedback is quite scarce, and the reviews on Trustpilot are also limited. Thus far, just like Chalet, it recorded two 5-star reviews:
Both Chalet and AirROI highlight Fort Lauderdale’s data by bedroom count. Chalet stands out by offering ZIP-code-level insights and AI-driven projections completely free. AirROI does offer an interactive map with all the listed Airbnbs, however lacks to group those insights to make it easily digestible.
Conclusion
Tools like AirDNA, Airbtics, Rabbu, and AirROI all have their strengths, and many professional hosts rely on them. Chalet adds another option: a transparent, no-cost benchmark that helps investors quickly understand market performance and compare opportunities with confidence. It’s designed for serious investors who need actionable data, not just charts.
The most important takeaway is not that one tool is “right” and the others are “wrong,” but that data should be treated as a guide, not a guarantee. Cross-checking multiple platforms can reveal both the consensus and the outliers, helping you set more realistic expectations. It’s equally important to layer market data with local knowledge, property-specific factors, and regulatory realities before making investment decisions.

