
You're not here for a "prettiest lake towns" listicle. You want to know where a waterfront Airbnb rental actually makes financial sense in 2026.
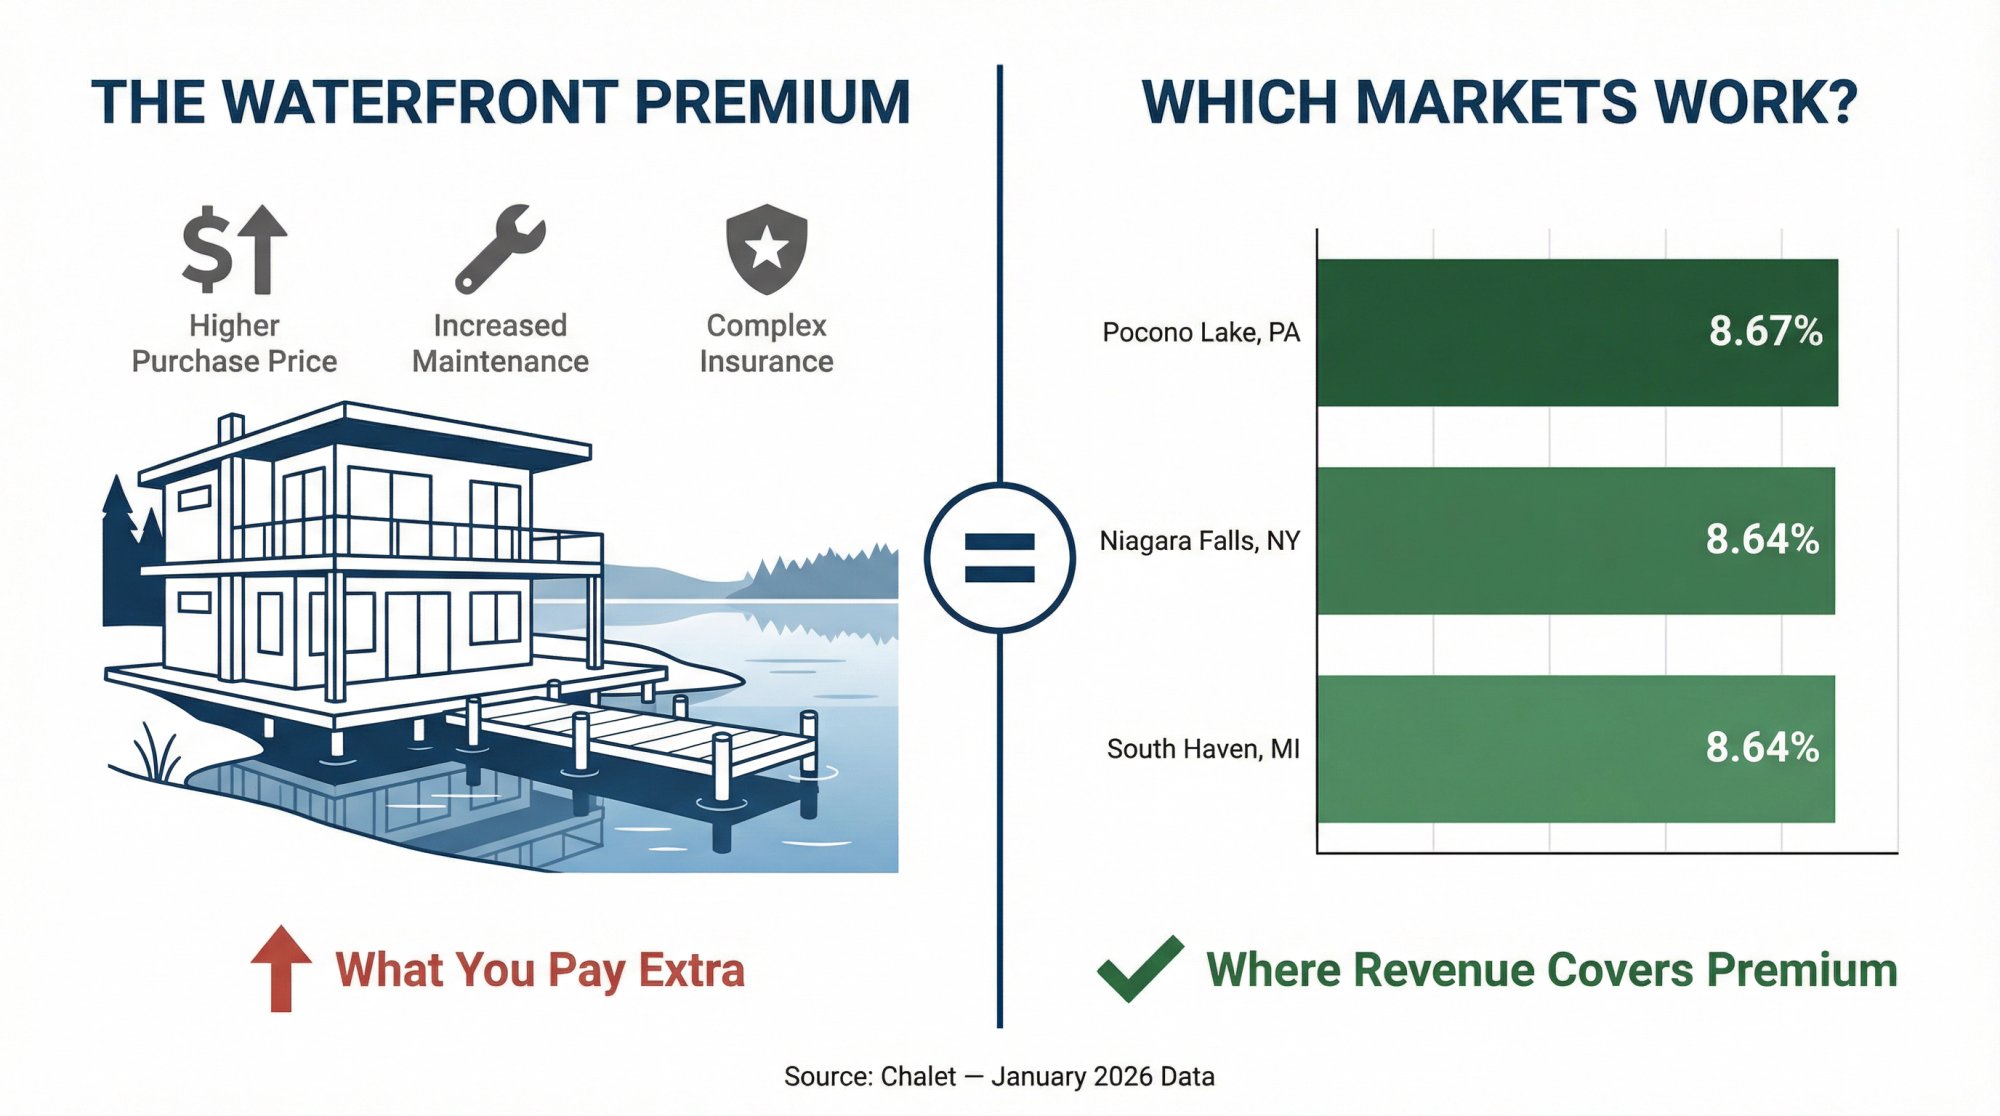
Waterfront investing has a trap that catches even experienced buyers: the waterfront premium. You pay more for the view and dock access, but you also inherit higher maintenance costs, insurance complexity, and (usually) more seasonal swings. The math only works when the market generates enough revenue to cover that premium and still leave margin.
This guide ranks 8 lake- and riverfront markets by gross yield using Chalet's January 2026 data snapshot. We'll also dig into what each market actually looks like for operators, whether you're buying your first short-term rental or adding to a portfolio.
A quick note on terminology: you'll see Airbnb rentals, short-term rentals, and STRs used interchangeably throughout. Same thing, different names.
Which Lake Markets Have the Highest Gross Yield in 2026?
Start your search in the top 3. They're the only markets in this set clearing 8.6% gross yield.
-
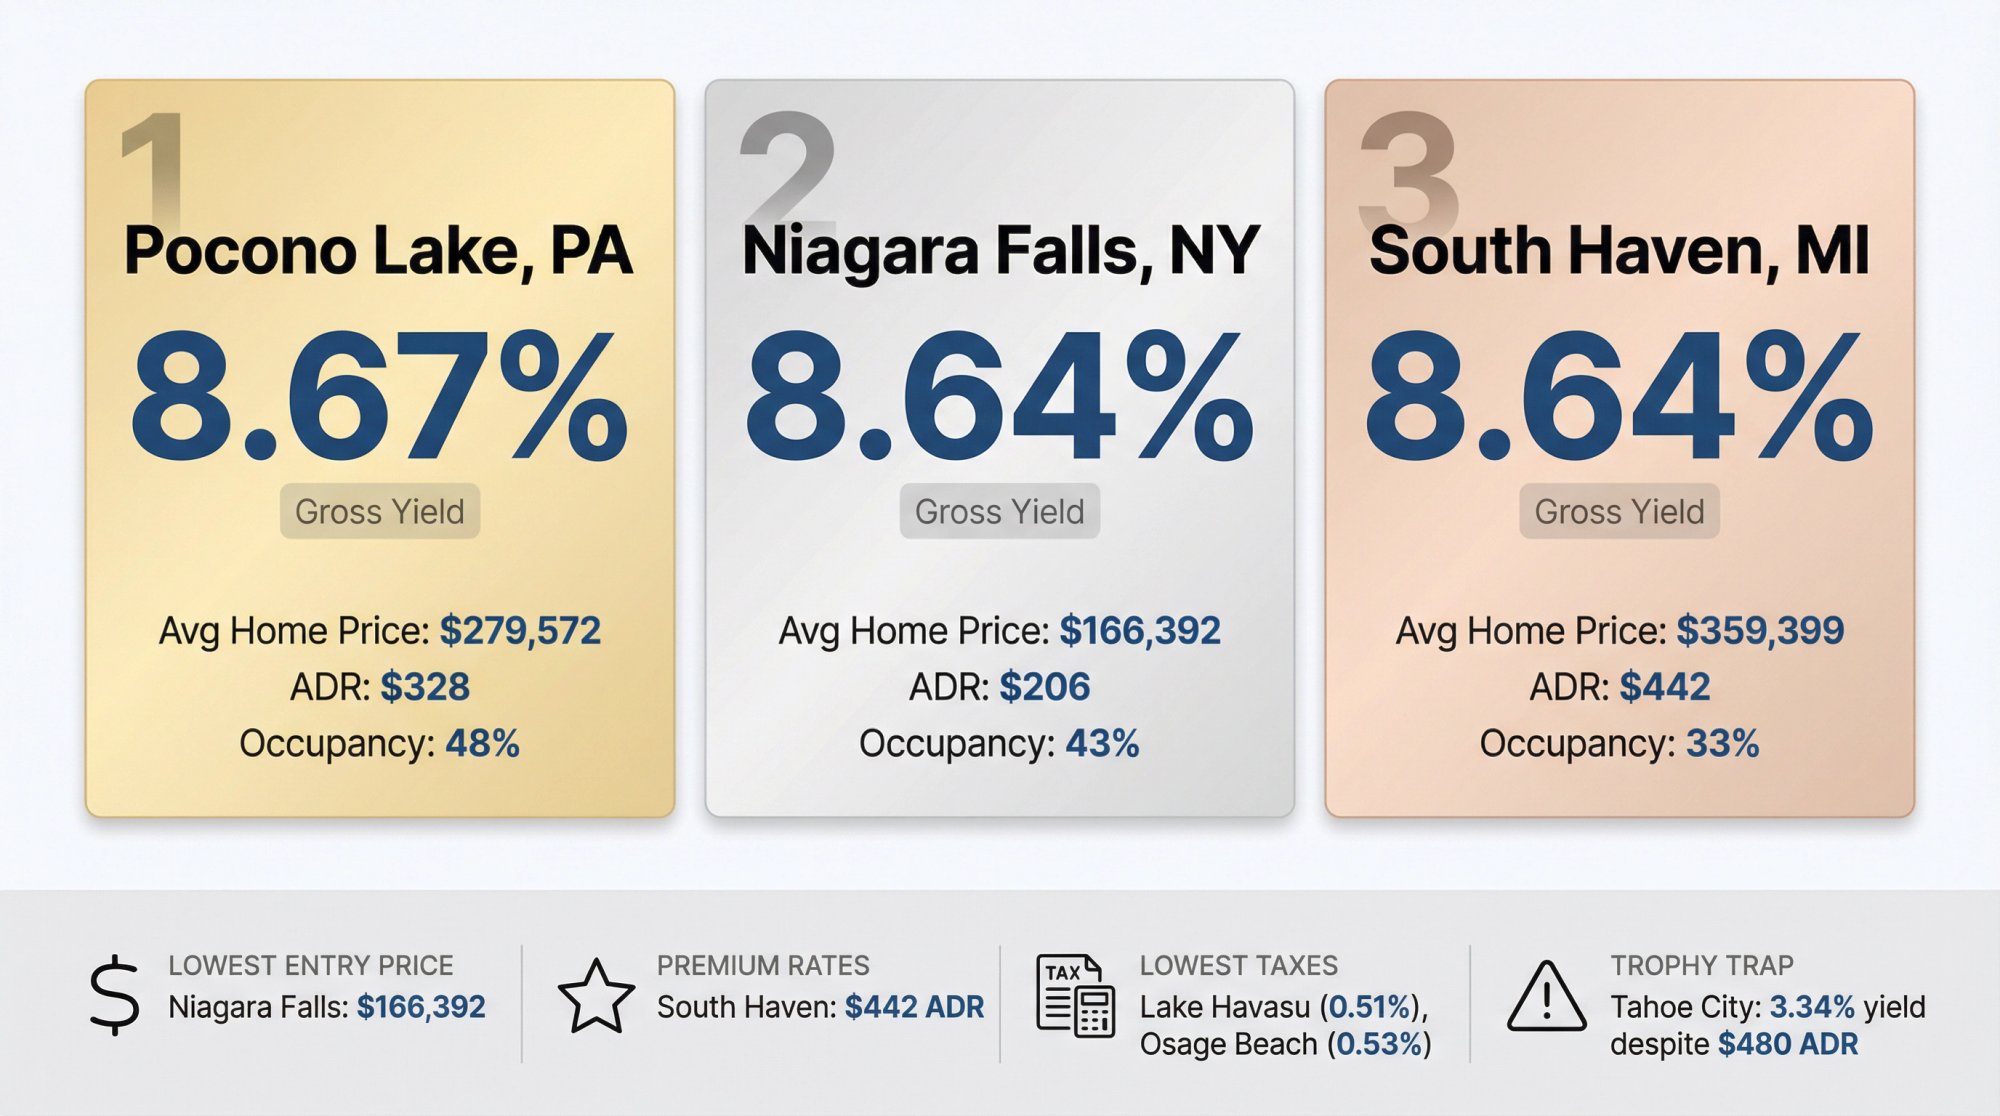
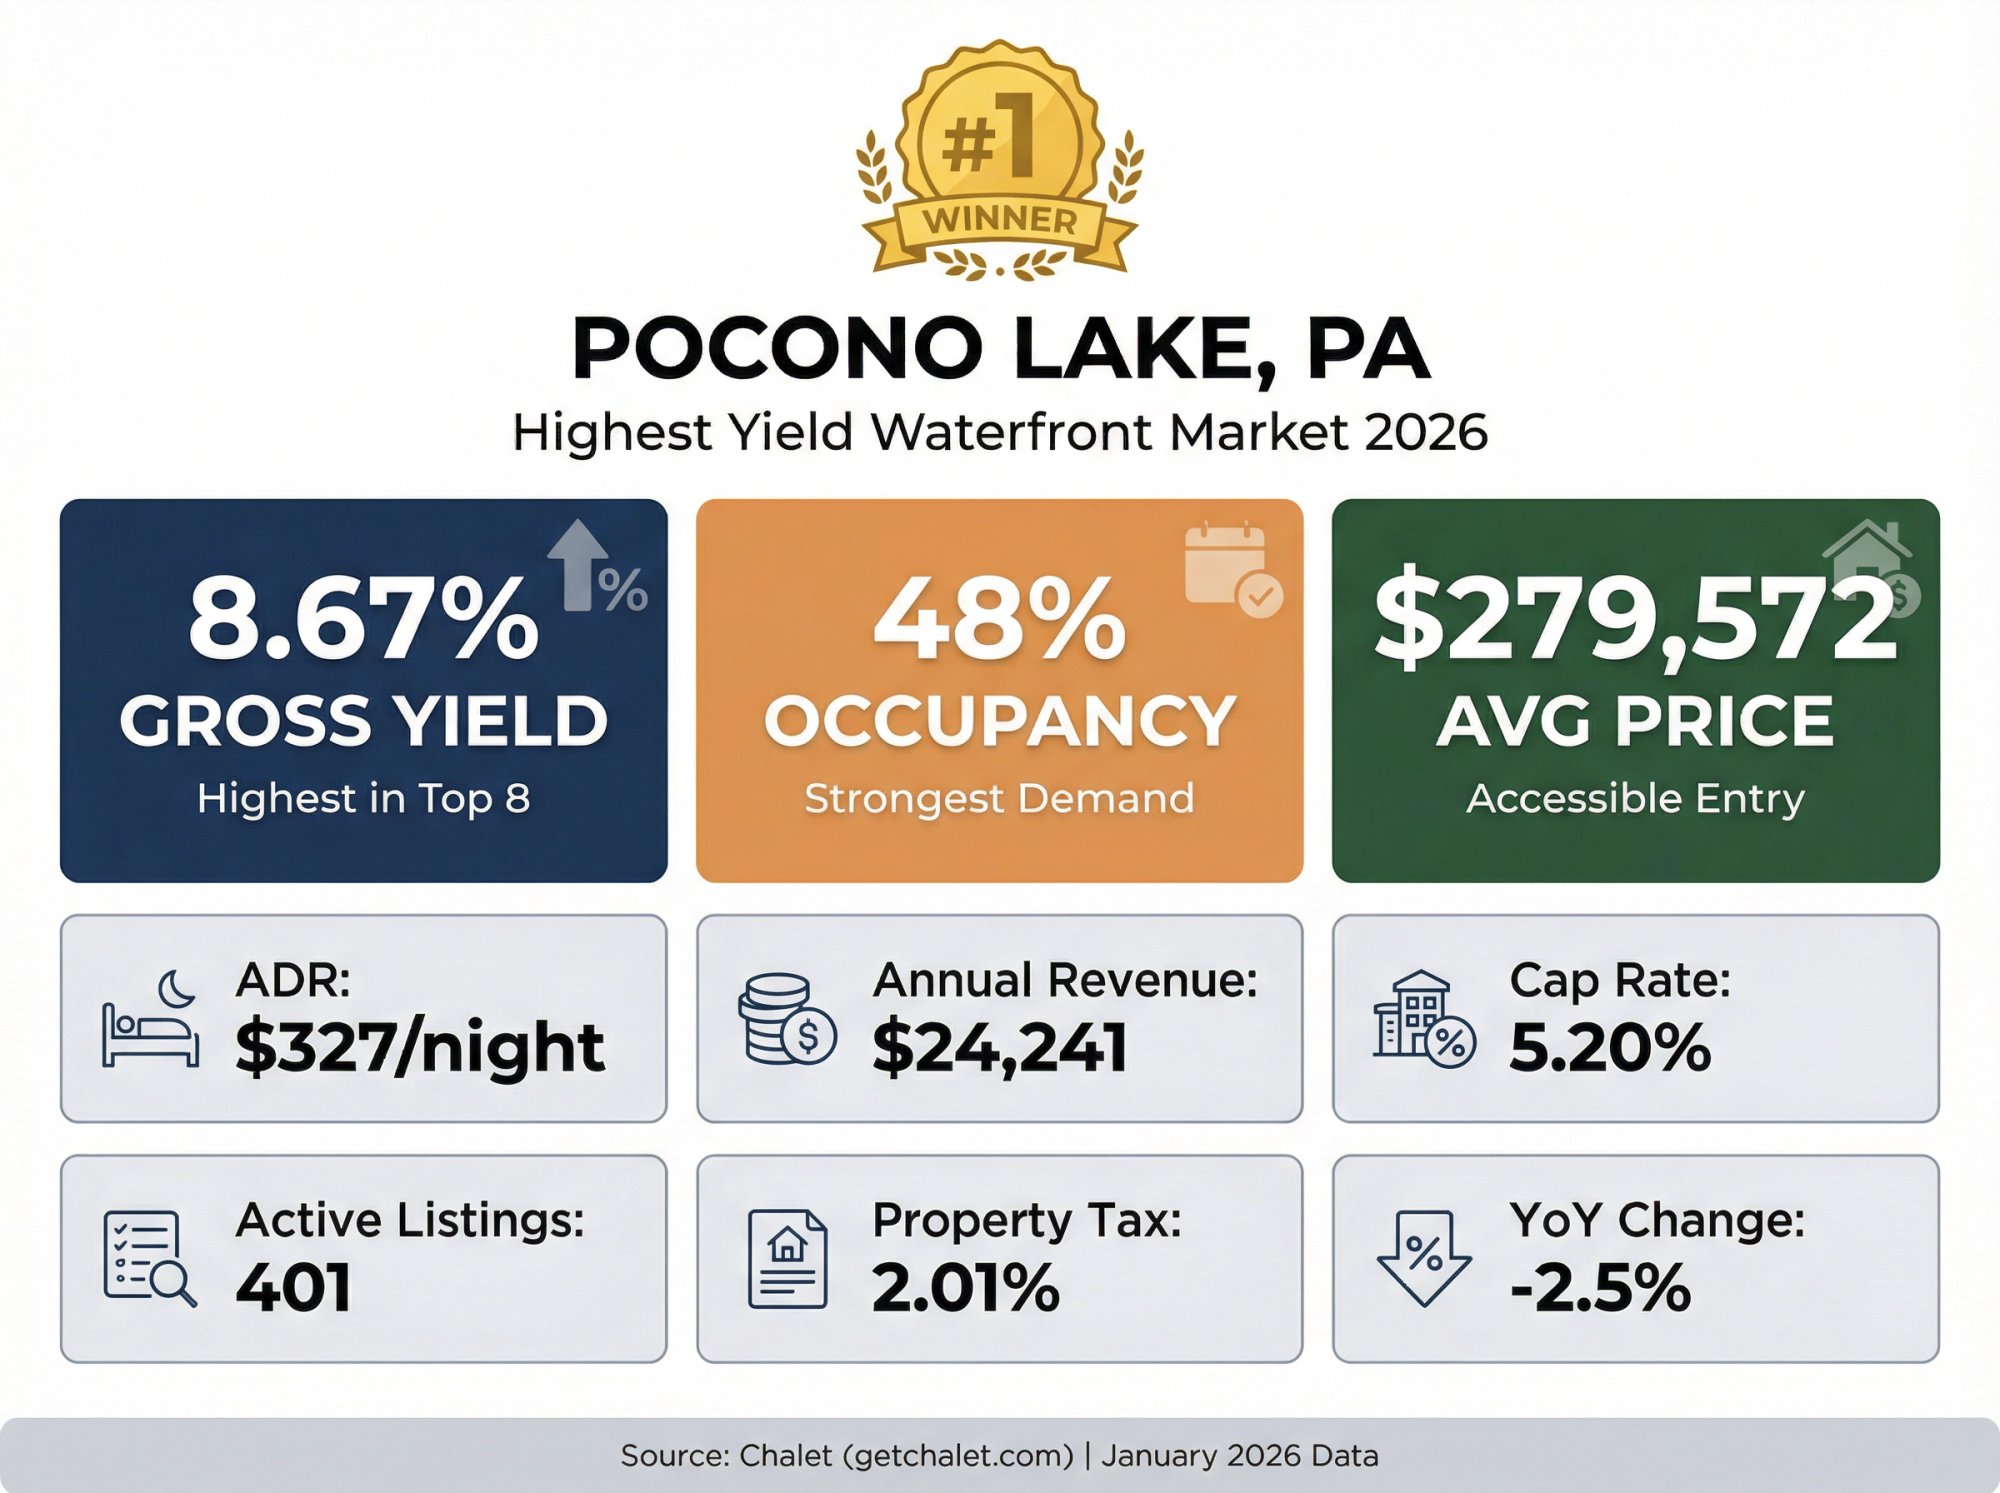
Highest overall yield: Pocono Lake, PA (8.67% gross yield)
-
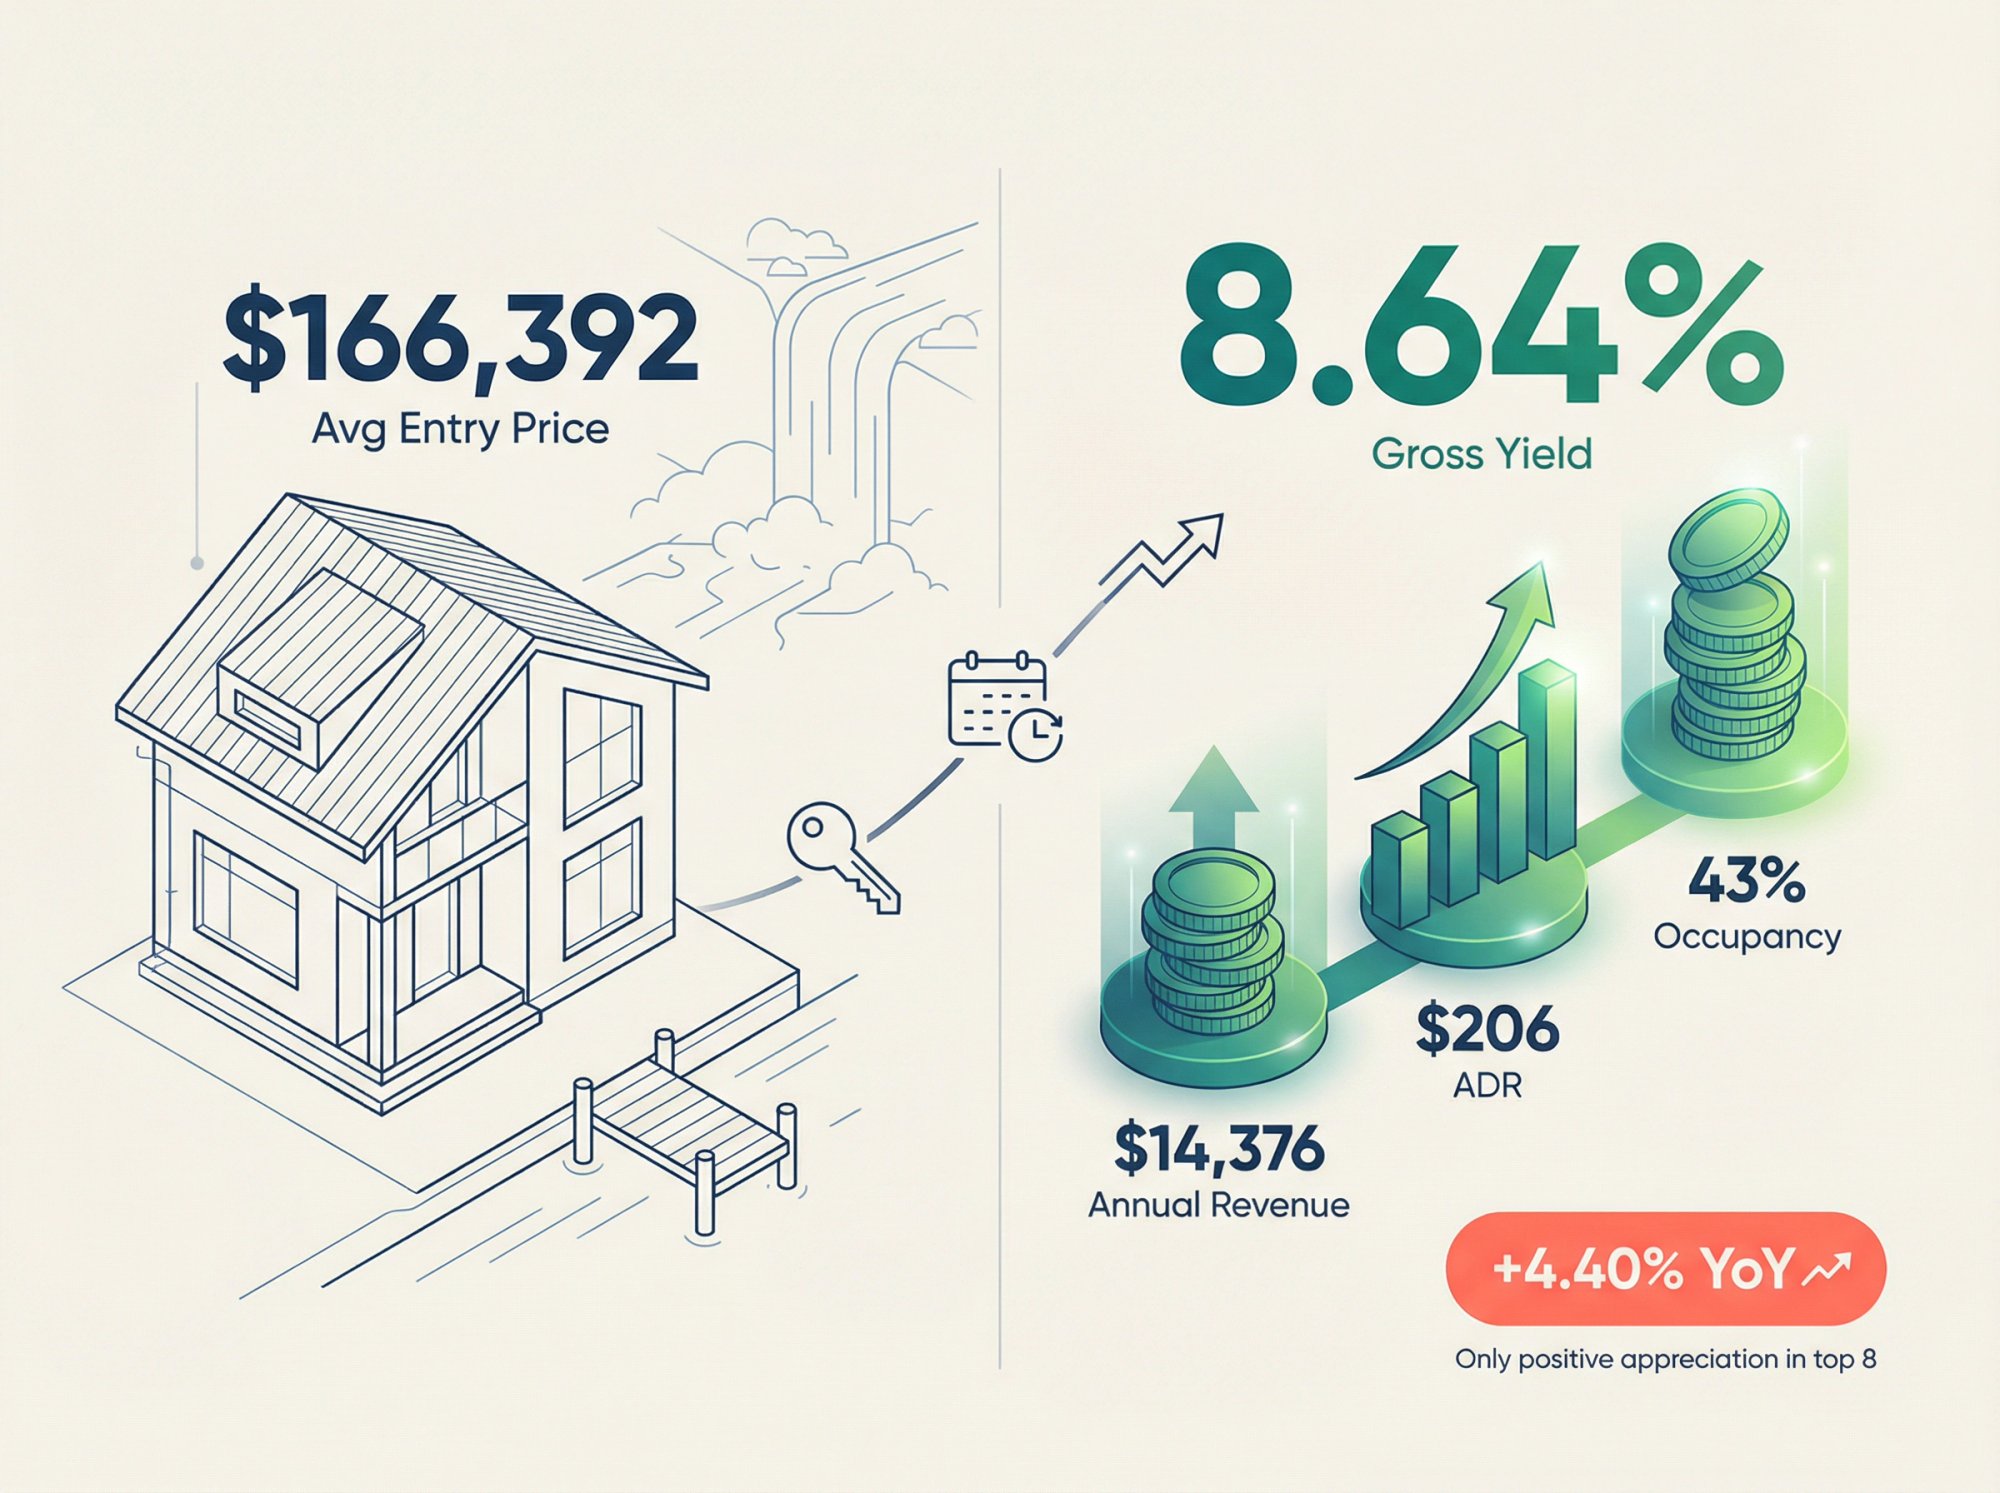
Lowest entry price with strong yield: Niagara Falls, NY ($166,392 average home price, 8.64% gross yield)
-
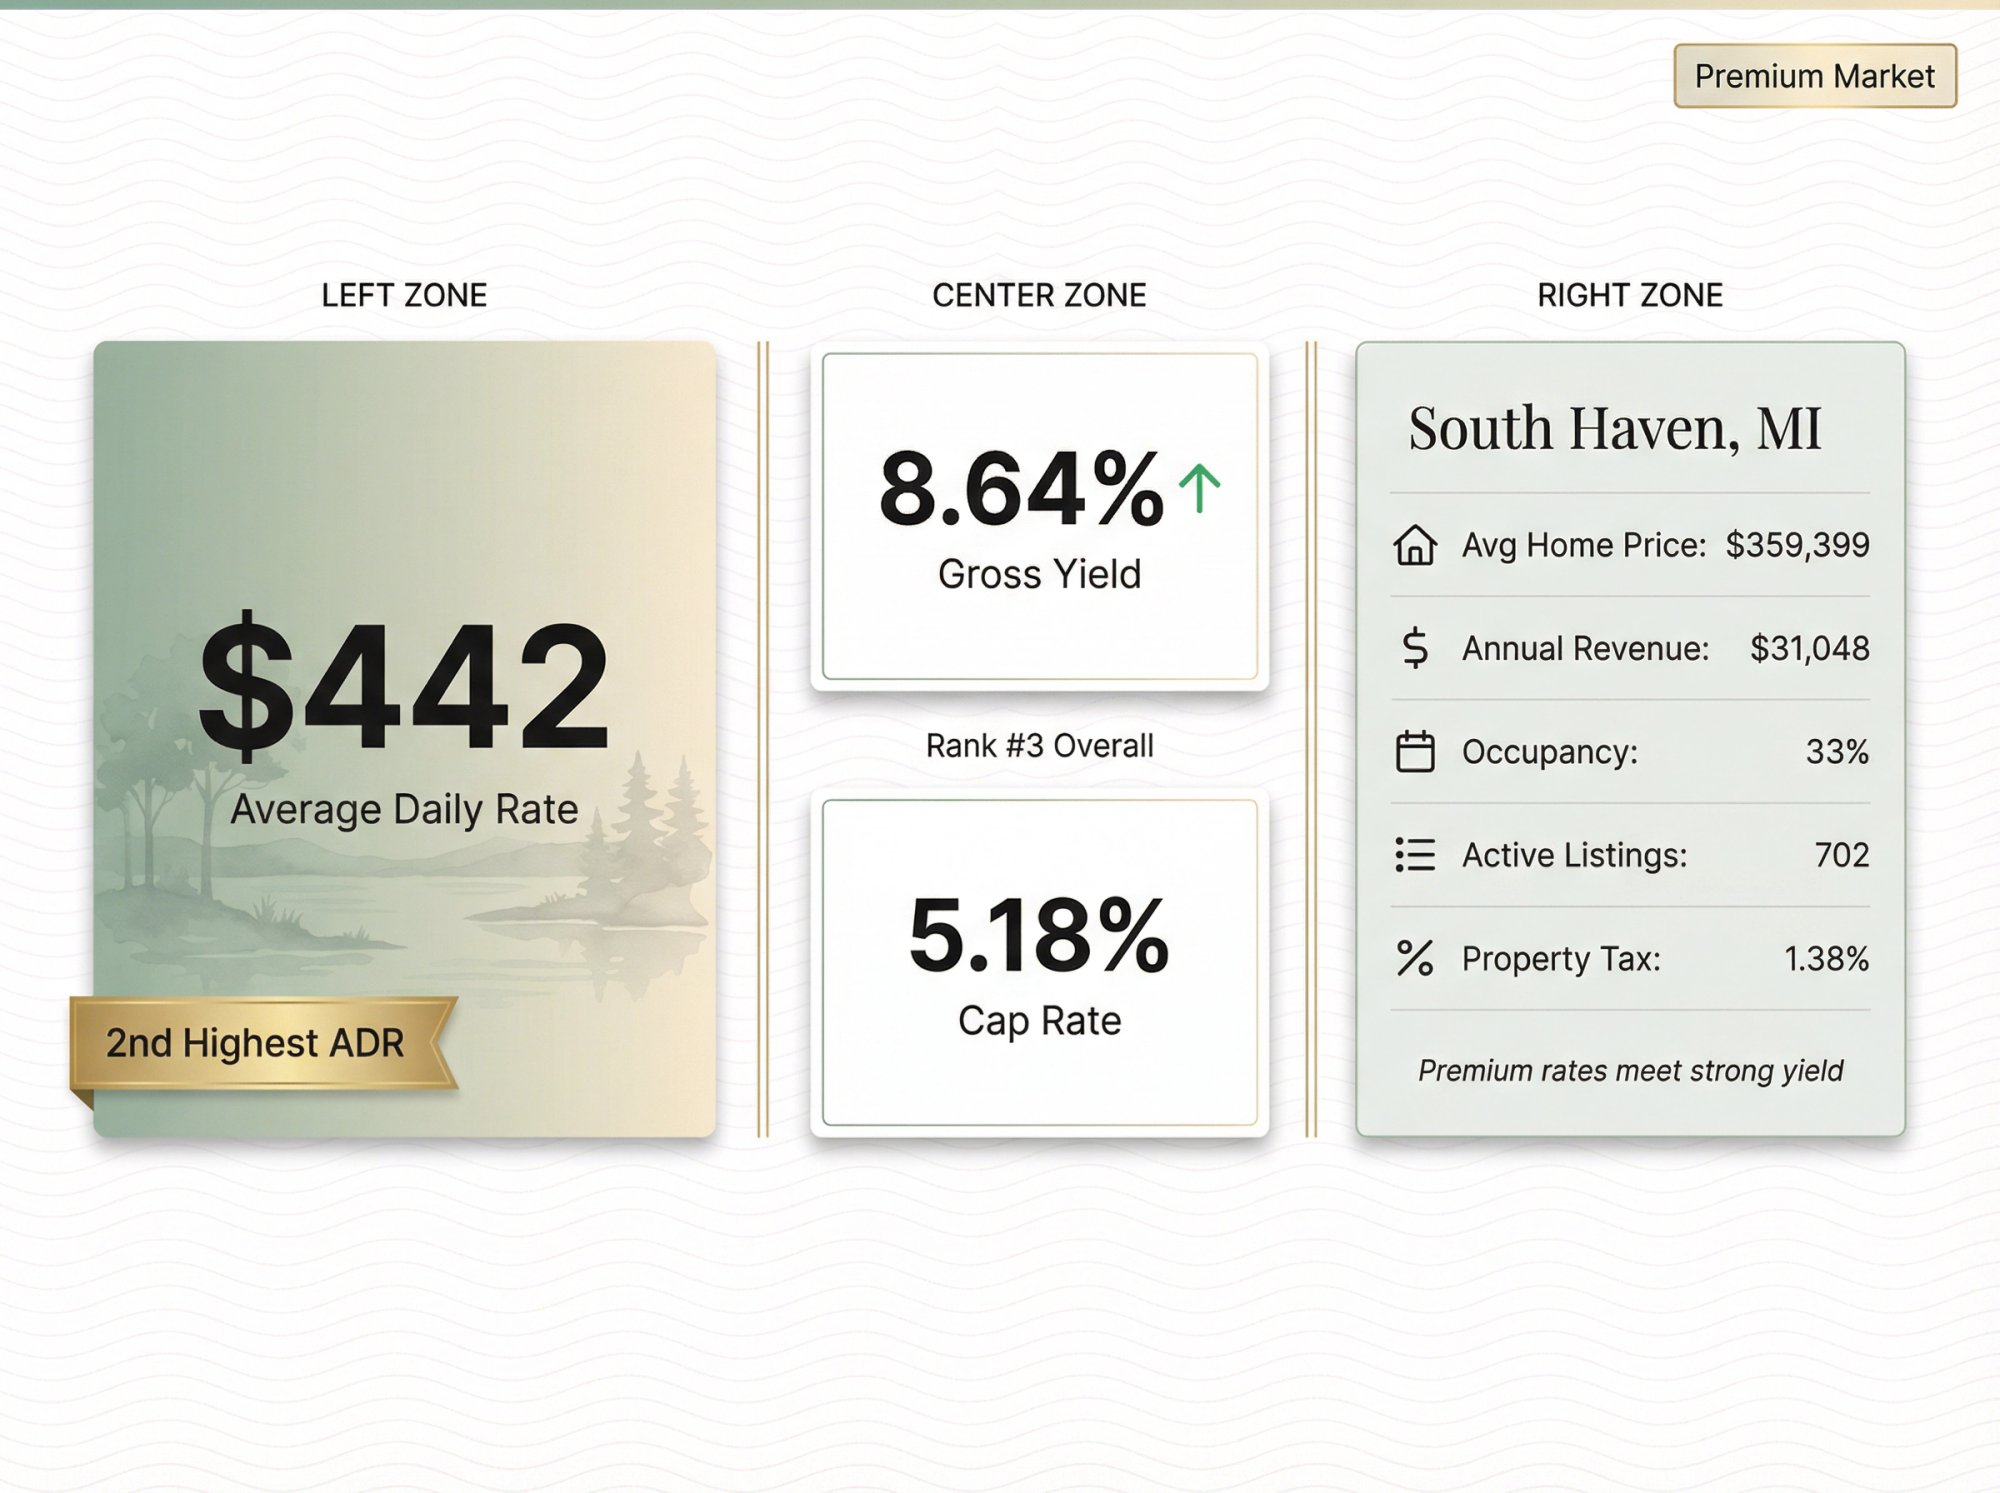
Premium nightly rates without sacrificing yield: South Haven, MI ($442 ADR, 8.64% gross yield)
-
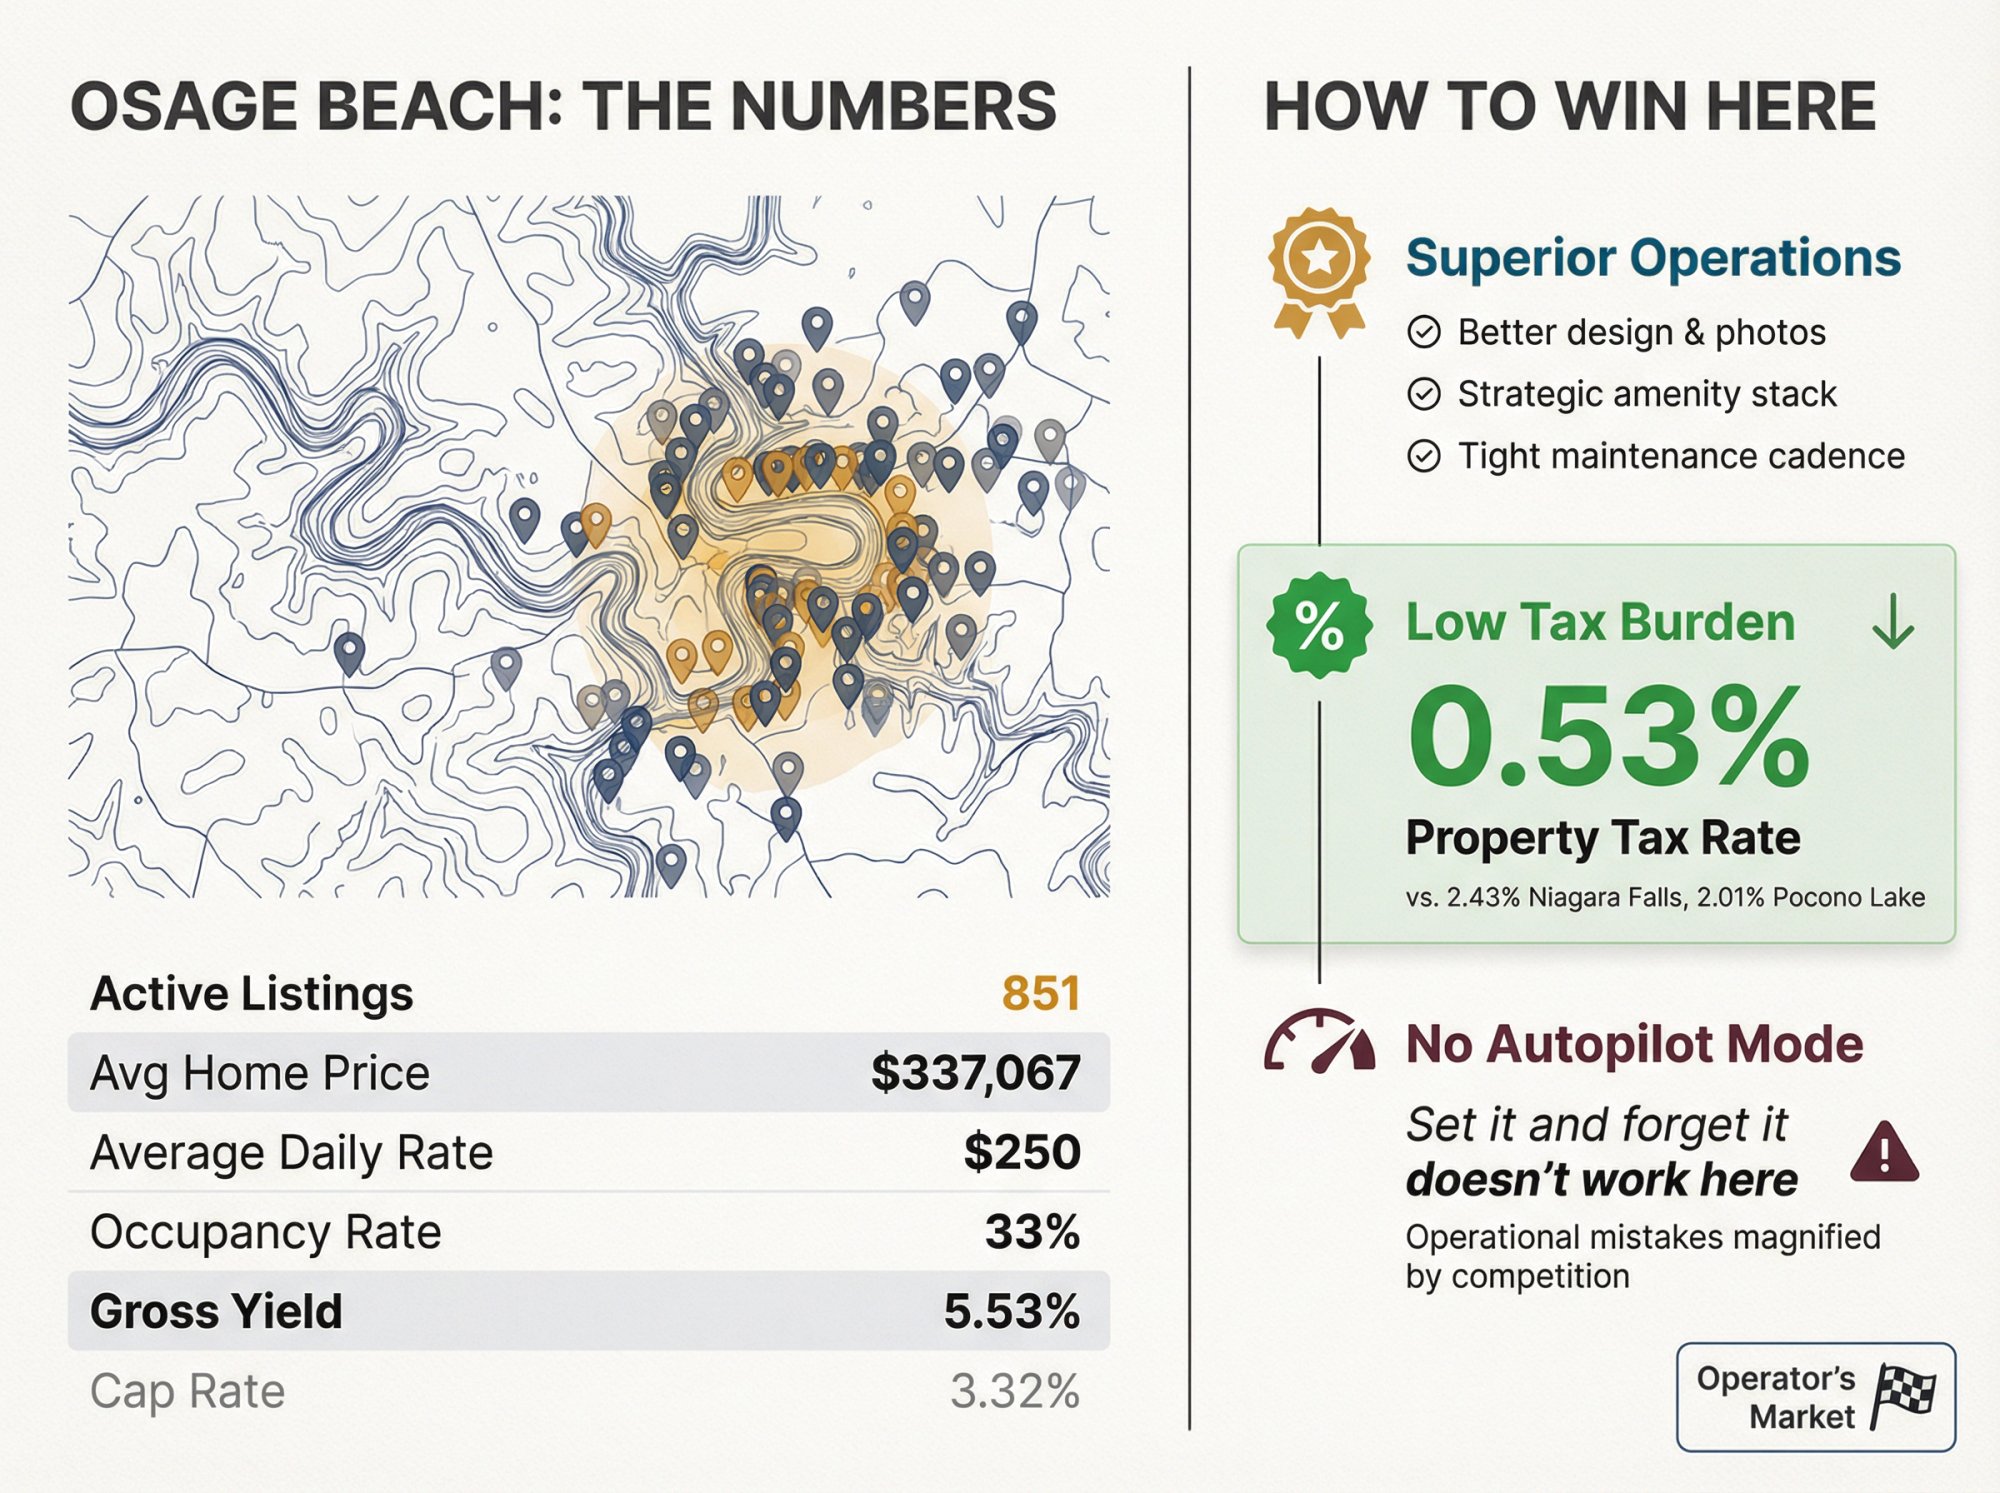
Lowest property tax rates: Lake Havasu City, AZ (0.51%), Osage Beach, MO (0.53%), Lake Ozark, MO (0.53%). See our guide to Airbnb markets with low property tax
-
Most competitive supply: Lake Havasu City (1,247 listings) and Osage Beach (851 listings). Learn how to compete in markets with more than 2,000 listings
-
Trophy market reality check: Tahoe City, CA posts the highest ADR ($480) and highest annual revenue ($39,427), but the lowest gross yield (3.34%) because you're paying over $1.18M on average to access it
Top 8 Waterfront Airbnb Markets Ranked by Yield (2026 Data)
Source: Chalet (getchalet.com), pulled January 12, 2026.
These are market averages and models. Your actual property (exact waterfront access, bedroom count, condition, local rules, management quality) will swing results significantly.
| Rank | Market | State | Zillow YoY Home Value Change | Avg Home Price | Active Listings | ADR | Occupancy | Annual Revenue | Gross Yield | Cap Rate | Property Tax |
|---|---|---|---|---|---|---|---|---|---|---|---|
| 1 | Pocono Lake | Pennsylvania | -2.50% | $279,572 | 401 | $327.53 | 48% | $24,241 | 8.67% | 5.20% | 2.01% |
| 2 | Niagara Falls | New York | +4.40% | $166,392 | 338 | $205.83 | 43% | $14,376 | 8.64% | 5.18% | 2.43% |
| 3 | South Haven | Michigan | -1.06% | $359,399 | 702 | $442.42 | 33% | $31,048 | 8.64% | 5.18% | 1.38% |
| 4 | Osage Beach | Missouri | -1.49% | $337,067 | 851 | $250.15 | 33% | $18,633 | 5.53% | 3.32% | 0.53% |
| 5 | Lake Arrowhead | California | -7.41% | $529,784 | 594 | $385.20 | 29% | $28,039 | 5.29% | 3.18% | 0.72% |
| 6 | Lake Ozark | Missouri | -2.55% | $333,833 | 530 | $253.08 | 25% | $16,005 | 4.79% | 2.88% | 0.53% |
| 7 | Lake Havasu City | Arizona | -2.76% | $456,716 | 1,247 | $267.29 | 36% | $21,201 | 4.64% | 2.79% | 0.51% |
| 8 | Tahoe City | California | -0.22% | $1,182,185 | 347 | $480.35 | 38% | $39,427 | 3.34% | 2.00% | 0.85% |
Want to dig deeper into any of these markets? Explore Chalet's free market analytics or jump straight to a specific dashboard:
For a broader look at high-yield STR markets, check our comprehensive analysis.
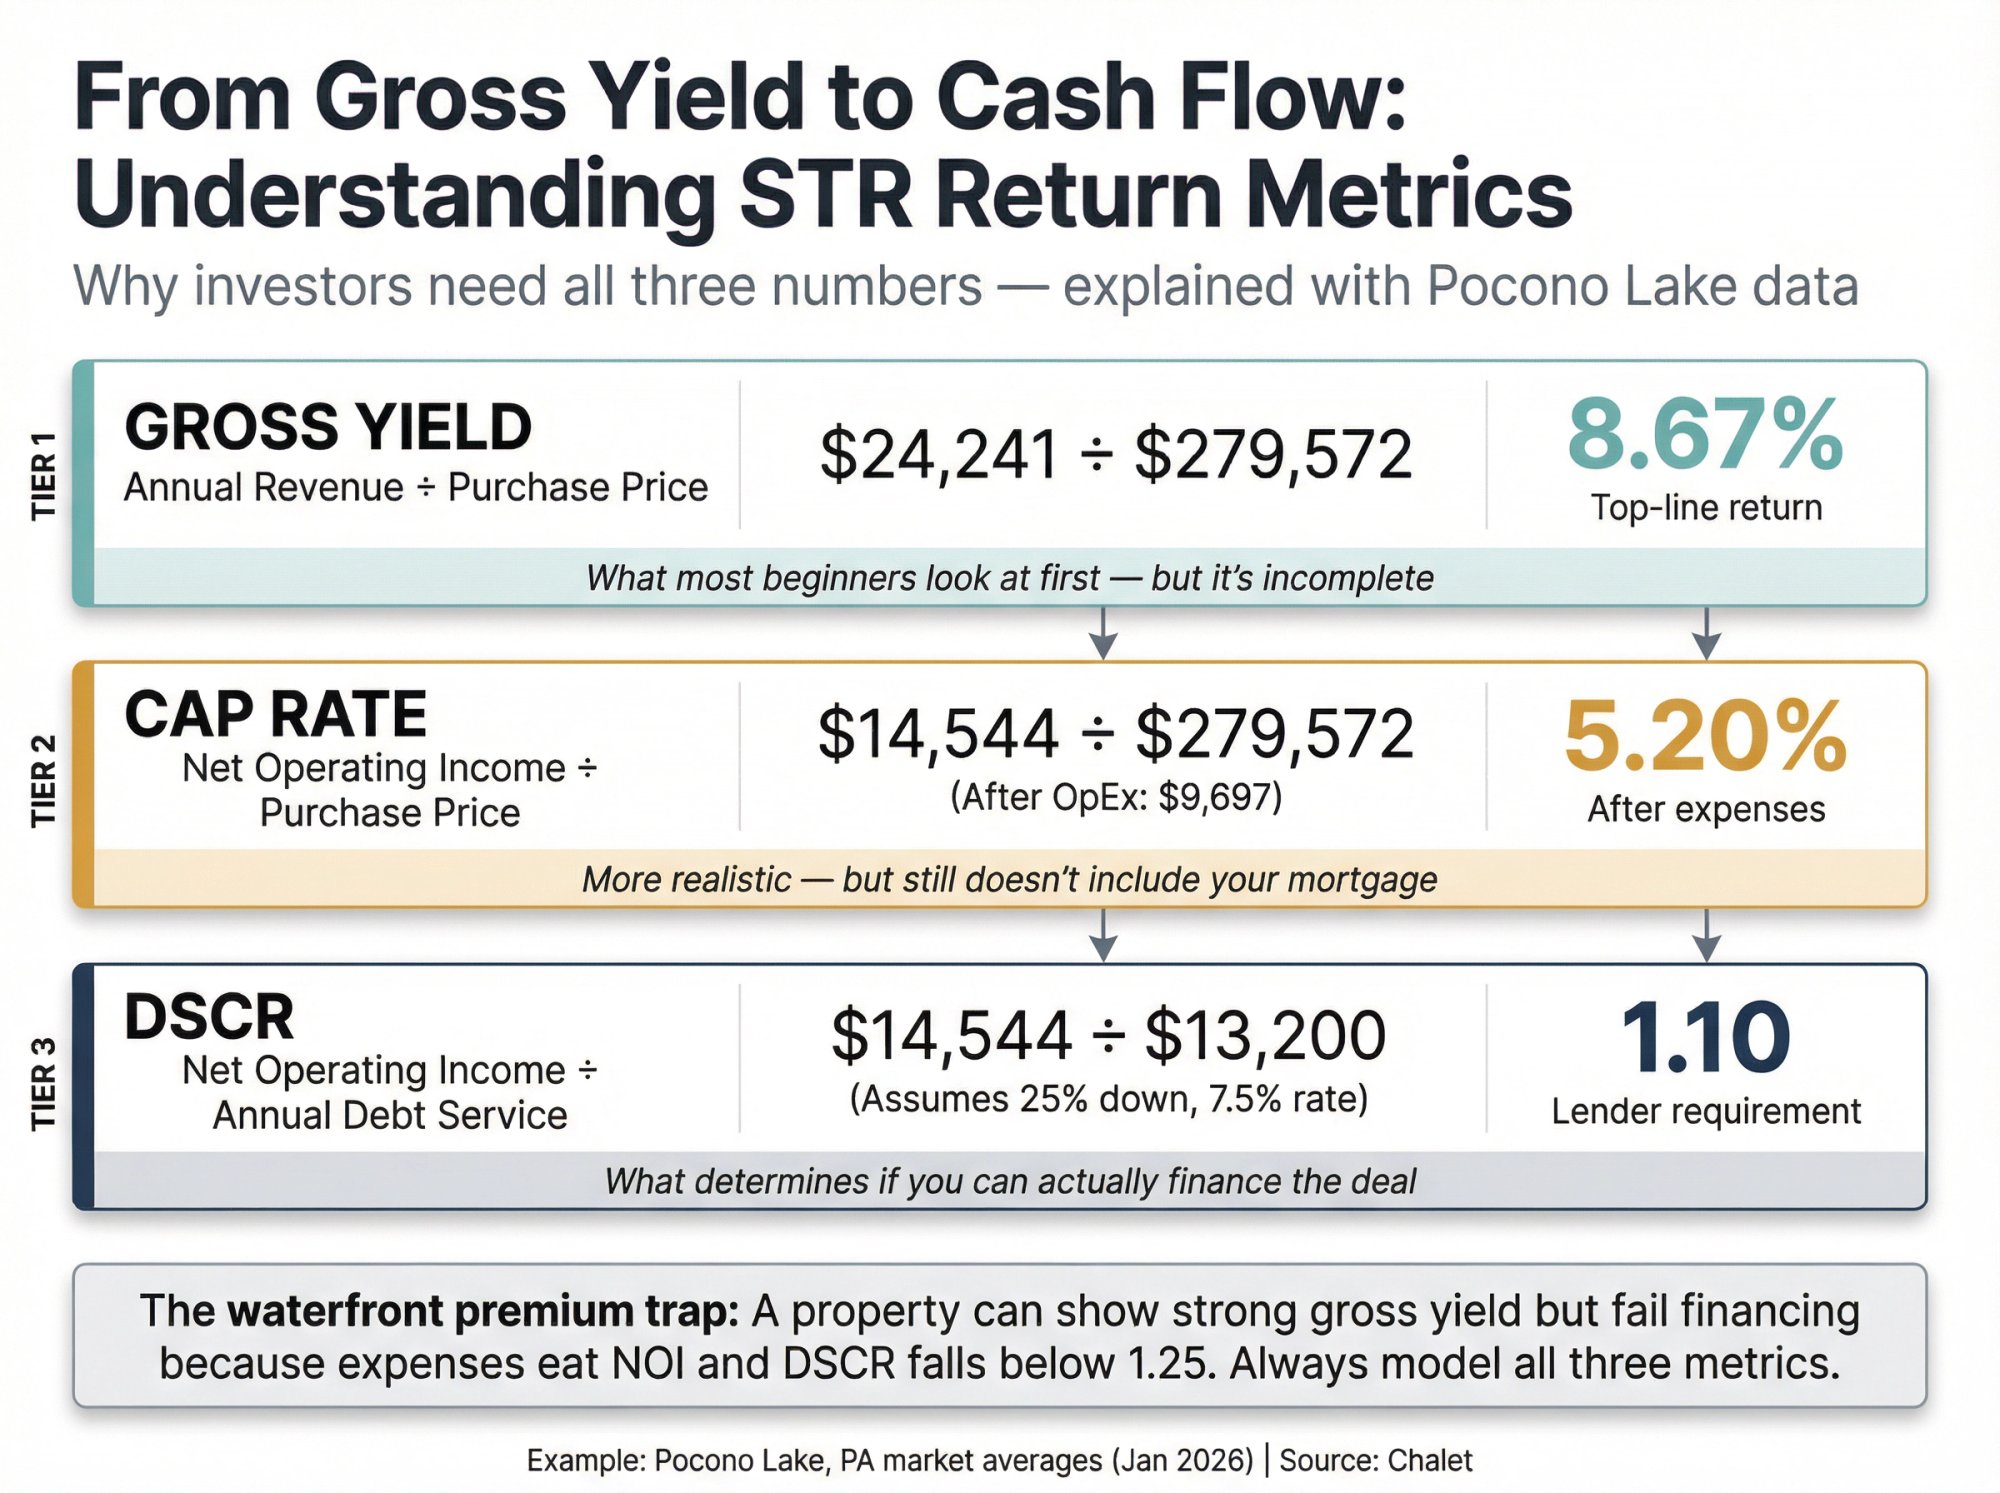
Gross Yield vs Cap Rate: What Each Metric Tells You
Two numbers matter most in this table, and most people confuse them. If you're new to short-term rental investing, here's the breakdown:
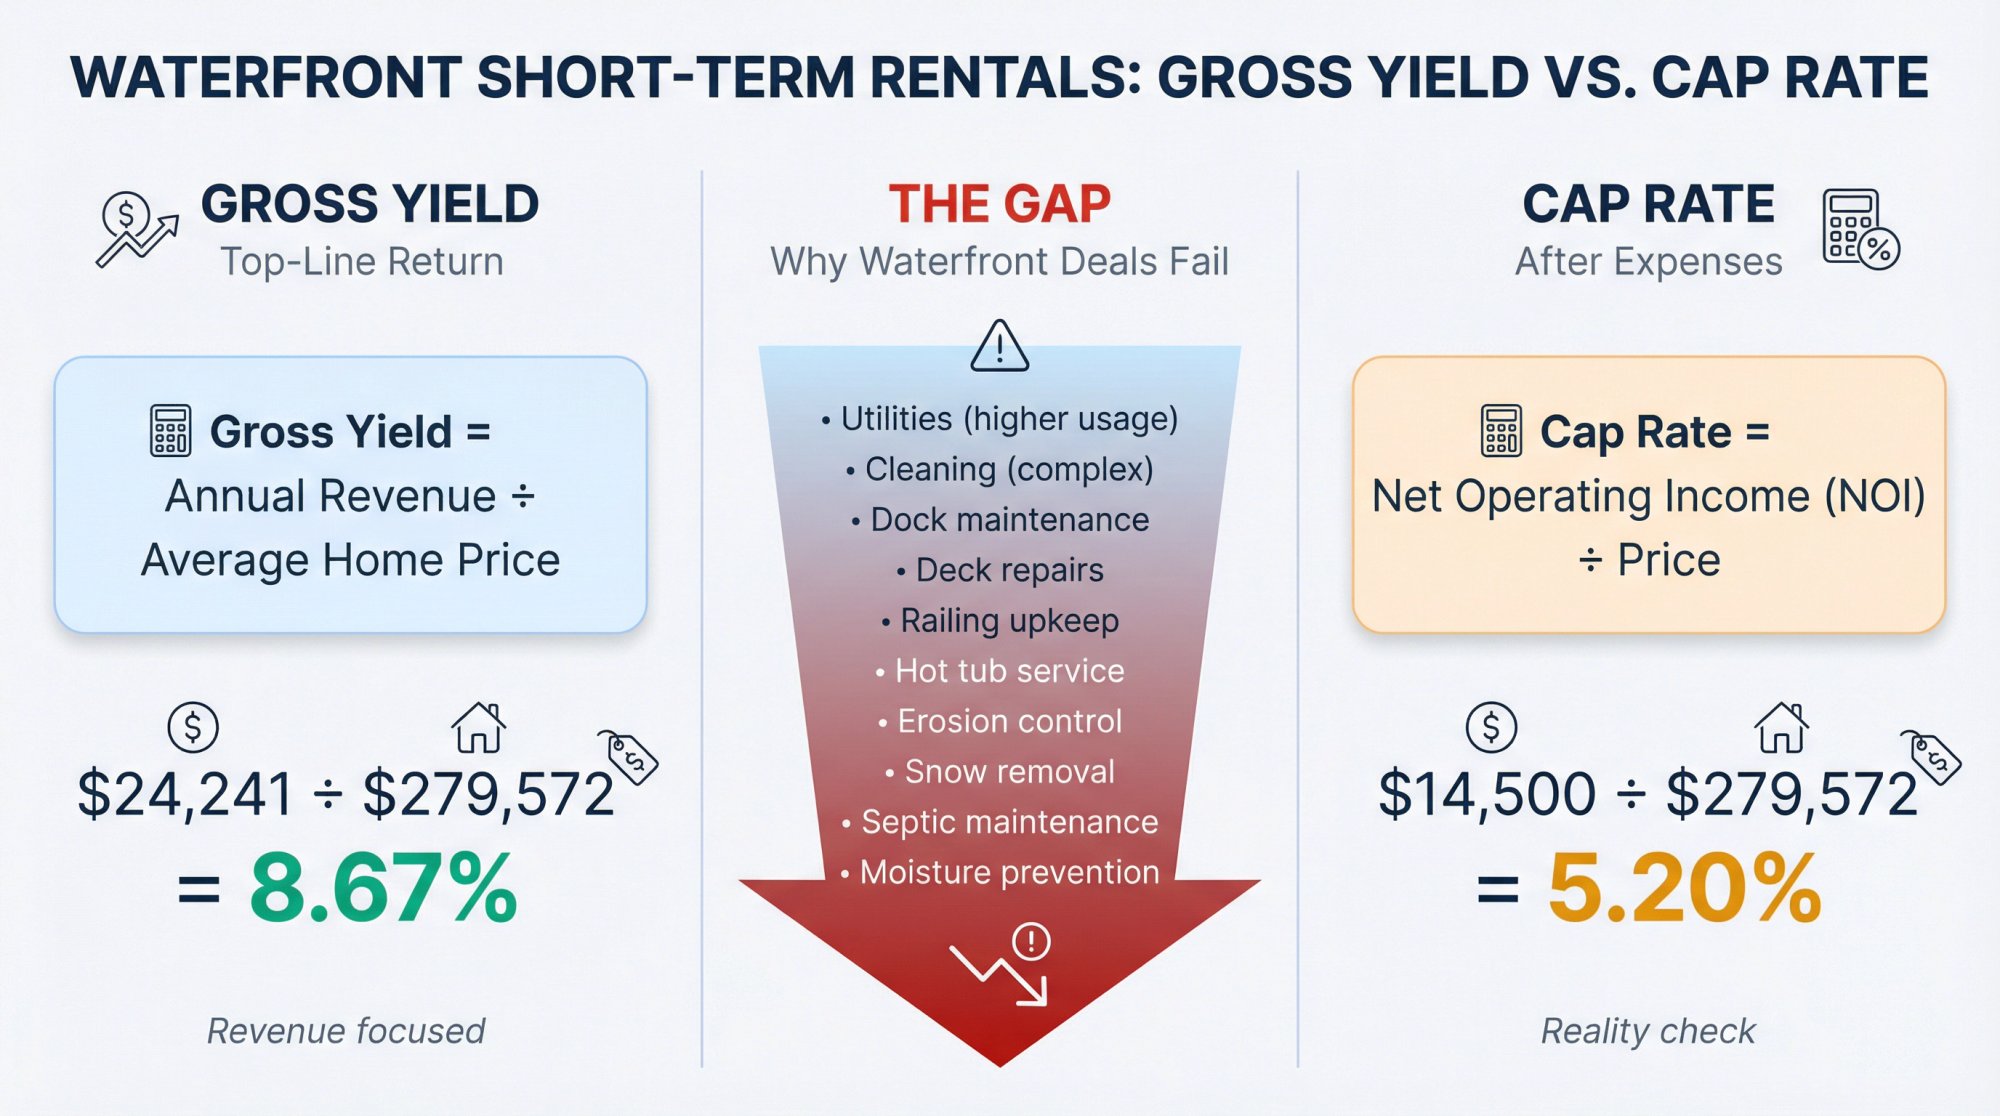
Gross yield is your top-line return:
Gross Yield = Annual Revenue / Average Home Price
Cap rate accounts for operating expenses:
Cap Rate = Net Operating Income (NOI) / Price
Here's why this distinction matters: waterfront deals often die in the gap between gross yield and cap rate. Utilities run higher. Cleaning is more complex. Repairs stack up (docks, decks, railings, hot tubs, erosion control). Insurance costs more. Snow removal, septic maintenance, moisture prevention… it adds up fast.
Notice how every market in our table shows cap rate lower than gross yield. That's the whole point. Don't buy off gross yield alone. Use cap rate as your reality check, then underwrite the specific property you're considering. For more on cap rate analysis, see our guide to Airbnb markets with high cap rates.
Want to run real numbers on an actual address? Use Chalet's free ROI and DSCR calculator.
How ADR and Occupancy Drive Your Revenue
A quick framework:
| Metric | What It Tells You |
|---|---|
| ADR (Average Daily Rate) | What you earn per booked night |
| Occupancy | How often you're actually booked |
| Annual Revenue | What you care about (ADR x Occupancy x 365) |
| Home Price | What you pay to access that revenue stream |
High ADR doesn't guarantee a good deal. Tahoe City has the highest ADR and revenue in this set, but it's also the most expensive market by a wide margin. So yields are actually the lowest. See how average Airbnb occupancy rates vary by city.
What Active Listings Tell You About Competition
More listings usually means two things:
-
More competitors (harder to stand out, especially if your property is average)
-
More market activity (easier to find comps, potentially easier to sell later)
Lake Havasu City's 1,247 listings and Osage Beach's 851 represent crowded markets. Niagara Falls (338) and Tahoe City (347) have less supply but bring their own challenges.
Why Most Lake Market Lists Get It Wrong
Waterfront isn't a feature. It's a business model.
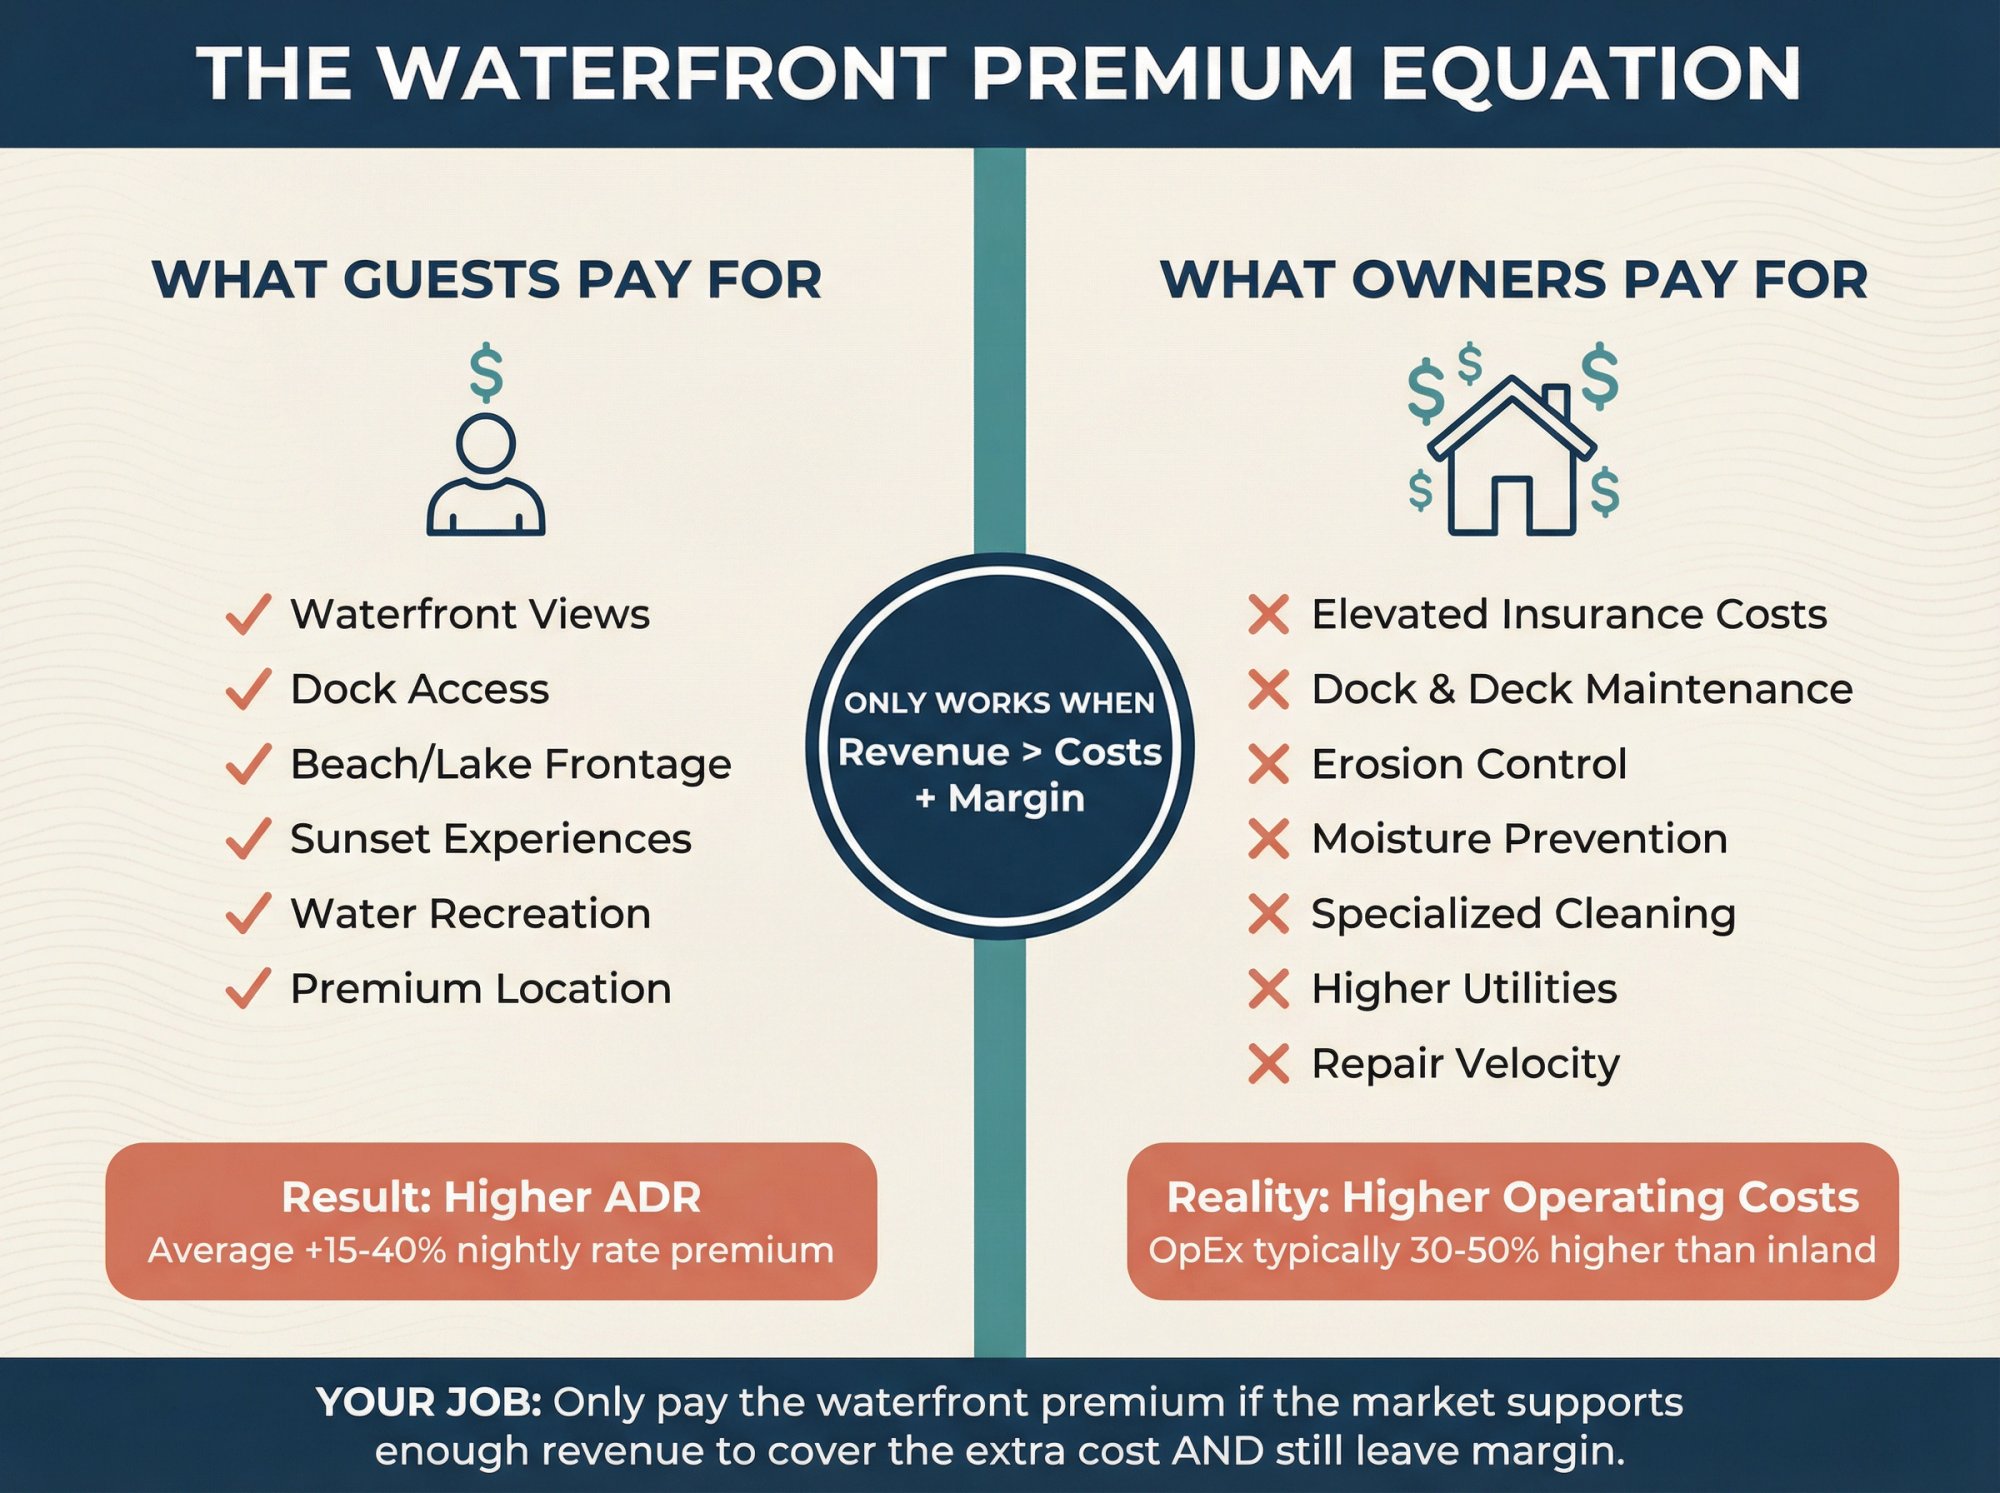
When you buy waterfront, you're really buying two things:
-
A view and access premium (guests pay extra for this)
-
A maintenance and insurance premium (you pay for this)
Your job as an investor is straightforward:
Only pay the waterfront premium if the market supports enough revenue to cover the extra cost and still leave margin.
That's exactly why ranking by gross yield first is useful. It forces you to start with markets where revenue is closer to the price you're paying. Understanding Airbnb profitability at the market level is step one.
Market Analysis: Top 8 Waterfront Markets for STR Investors
Pocono Lake PA: Highest Yield Waterfront Market (8.67%)
Why it's ranked #1: Highest gross yield in the set (8.67%) paired with the highest occupancy (48%). That combination is genuinely rare in waterfront markets.
January 2026 Snapshot:
| Metric | Value |
|---|---|
| Average Home Price | $279,572 |
| Annual Revenue | $24,241 |
| Gross Yield | 8.67% |
| Cap Rate | 5.20% |
| ADR | $327 |
| Occupancy | 48% |
| Active Listings | 401 |
| Zillow YoY | -2.50% |
| Property Tax Rate | 2.01% (~$5,619/year) |
The Investor Profile:
This is a classic yield-first market. Price is reasonable, demand looks solid, and the numbers actually work for most financing scenarios. The Poconos pull weekend traffic from NYC, Philly, and the DC corridor, which helps explain the stronger occupancy compared to other lake markets. For more on this region, explore our mid-term rental markets in the Poconos guide.
The catch? Property taxes are material here. If your specific parcel runs higher than the 2.01% average, your real cap rate compresses quickly. Build that into your underwriting.
→ Best for:
-
First-time STR buyers who want a realistic shot at cash flow
-
Investors looking for "drive-to getaway" demand without trophy-market pricing
→ Watch-outs:
-
Build a maintenance reserve from day one. Waterfront wear is real, and Pocono winters don't help.
-
Verify your parcel's taxes, any HOA restrictions, and local permit requirements before you get too far.
Next Step: Start with Chalet's market analytics, then underwrite specific addresses with the ROI calculator. Consider 1031 exchange options in Pennsylvania if you're rolling gains from another property.
Niagara Falls NY: Lowest Entry Price with Strong Yield
Why it's ranked #2: Very high gross yield (8.64%) driven by the lowest average home price in the top 8 ($166,392). This is the "cheap entry" profile.
January 2026 Snapshot:
| Metric | Value |
|---|---|
| Average Home Price | $166,392 |
| Annual Revenue | $14,376 |
| Gross Yield | 8.64% |
| Cap Rate | 5.18% |
| ADR | $206 |
| Occupancy | 43% |
| Active Listings | 338 (lowest supply in set) |
| Zillow YoY | +4.40% (only positive YoY in list) |
| Property Tax Rate | 2.43% (~$4,043/year) |
The Investor Profile:
This market essentially says: "Good yield because price is low, not because revenue is massive." You're not going to generate South Haven-level nightly rates here, but you're also not deploying $350K+ to get started.
The flip side? Property tax is the highest rate in the top 8. At 2.43%, taxes eat a real chunk of your net operating income. Factor that in before you get excited about the entry price.
Niagara Falls is the only market in this set showing positive home value appreciation year-over-year (+4.40%).
That could signal building demand or just market noise. Either way, it's worth watching.
Best for:
-
First-time investors who need a lower capital entry point. See our must-read guide to investing in your first Airbnb rental
-
Buyers who want to learn STR operations before scaling to larger markets
Watch-outs:
-
Don't get hypnotized by yield without validating real operating costs and local rules at the address level
-
The lower price point often comes with older housing stock. Budget for deferred maintenance.
Next Step: Browse Chalet's analytics to compare markets, then run numbers on specific listings with the calculator. Explore 1031 exchange opportunities in New York state.
South Haven MI: Premium Rates Without Losing Yield
Why it's ranked #3: Ties for second-highest gross yield (8.64%) while posting a standout ADR ($442). This is the "premium nightly rate without losing yield" combination.
January 2026 Snapshot:
| Metric | Value |
|---|---|
| Average Home Price | $359,399 |
| Annual Revenue | $31,048 |
| Gross Yield | 8.64% |
| Cap Rate | 5.18% |
| ADR | $442 |
| Occupancy | 33% |
| Active Listings | 702 |
| Zillow YoY | -1.06% |
| Property Tax Rate | 1.38% (~$4,960/year) |
The Investor Profile:
South Haven proves you can charge premium rates and still maintain solid yield, if the purchase price stays reasonable. The $442 ADR is the second-highest in the set (behind only Tahoe City), but the $359K average home price keeps the math working.
With 702 active listings, though, you can't afford to be average. Higher ADR markets reward operators who invest in experience, quality photography, and guest communication. They also punish sloppy execution harder than budget markets do. For a statewide perspective, see our analysis of Airbnb markets in Michigan.
The key insight here: South Haven shows that premium pricing and strong yield can coexist when you're disciplined about purchase price.
Best for:
-
First-timers with a bit more budget who want higher nightly rates
-
Portfolio builders who know how to differentiate a listing and manage reviews
Watch-outs:
-
Seasonality can make "33% average occupancy" misleading. Underwrite month-by-month in your own model.
-
Higher ADR properties attract guests with higher expectations. Maintenance response time and cleanliness standards matter more here.
Next Step: Explore the South Haven market dashboard, then underwrite specific listings with Chalet's calculator. If you're doing a 1031 exchange in Michigan, South Haven is worth serious consideration.
Osage Beach MO: Low Taxes, High Competition
The profile: Mid-pack yield (5.53%) with low property tax (0.53%) and high supply (851 listings). This looks like an operator's market.
January 2026 Snapshot:
| Metric | Value |
|---|---|
| Average Home Price | $337,067 |
| Annual Revenue | $18,633 |
| Gross Yield | 5.53% |
| Cap Rate | 3.32% |
| ADR | $250 |
| Occupancy | 33% |
| Active Listings | 851 |
| Zillow YoY | -1.49% |
| Property Tax Rate | 0.53% (~$1,786/year) |
The Investor Profile:
Lower taxes definitely help net returns. At 0.53%, Osage Beach is one of the most tax-friendly markets in this list. But the yield here sits meaningfully below the top 3, which means you're betting on your ability to outperform averages rather than riding market-level tailwinds.
With 851 listings, you win through execution: better design, better photos, better amenities, tighter operations. "Set it and forget it" doesn't work here. Learn what separates winners from the rest in our guide to factors affecting Airbnb profitability.
→ Best for:
-
Portfolio builders who can compete in crowded markets
-
Investors who prioritize low tax burden in their underwriting
→ Watch-outs:
-
High competition magnifies operational mistakes
-
Peak season turnovers and maintenance cadence need to run smoothly, or reviews suffer
Next Step: Check the Osage Beach dashboard and start building your operator stack with Chalet's vendor directory. Consider 1031 exchange options at Osage Beach.
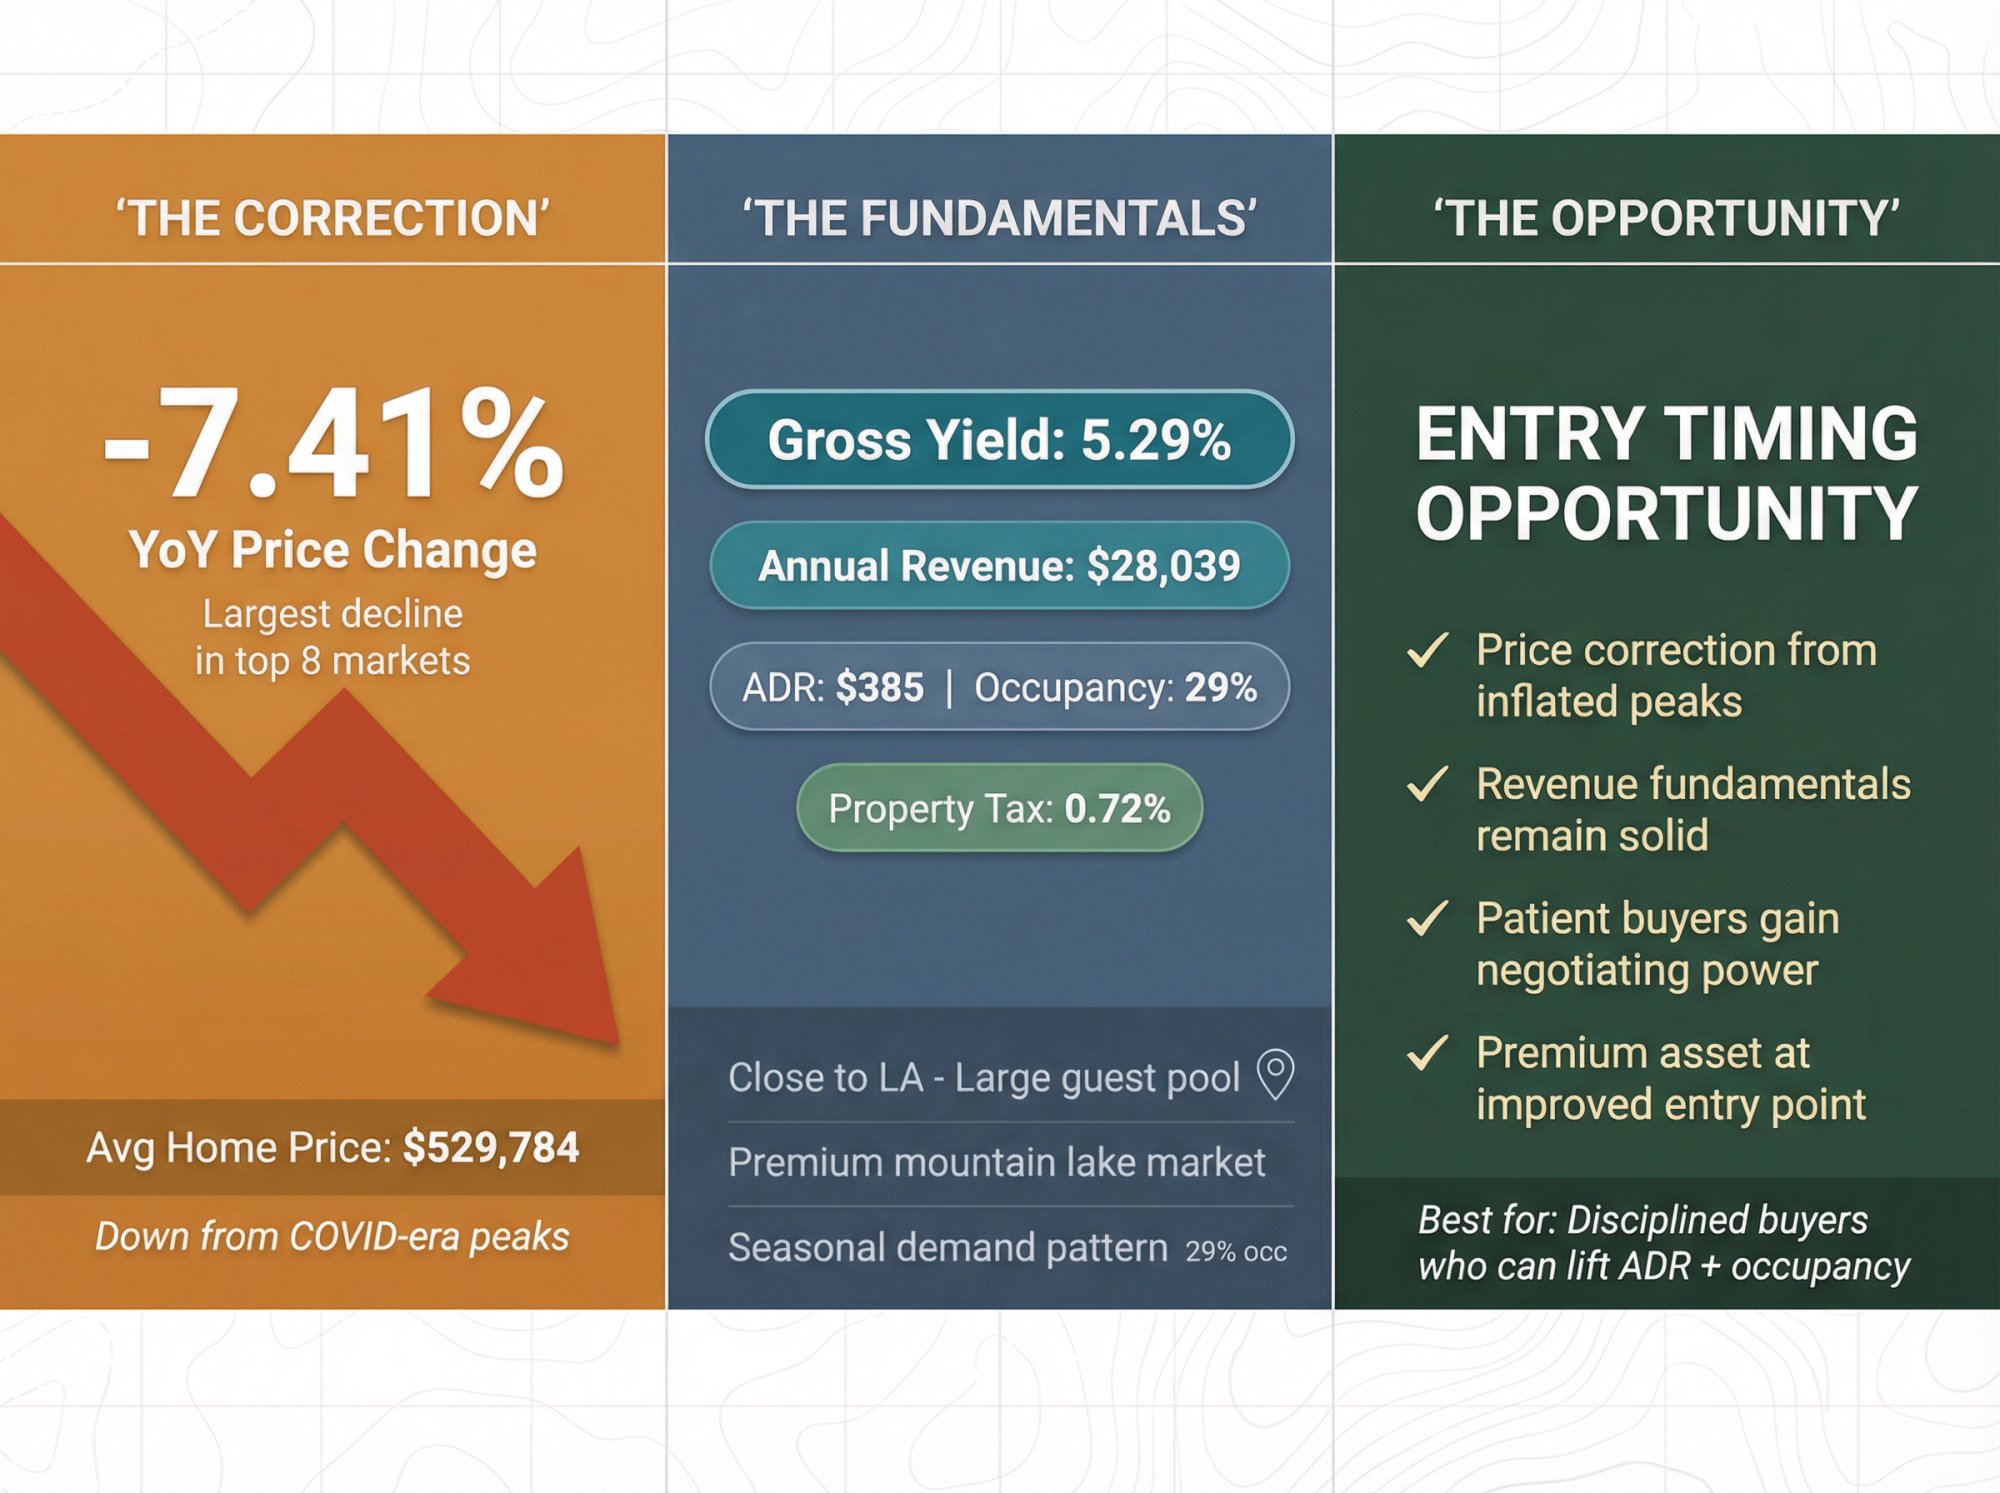
Lake Arrowhead CA: Premium Market with Pricing Risk
The profile: Moderate yield (5.29%), higher prices ($529,784), and the biggest YoY home value decline in this list (-7.41%). This can be an "entry timing" market if you underwrite conservatively.
January 2026 Snapshot:
| Metric | Value |
|---|---|
| Average Home Price | $529,784 |
| Annual Revenue | $28,039 |
| Gross Yield | 5.29% |
| Cap Rate | 3.18% |
| ADR | $385 |
| Occupancy | 29% |
| Active Listings | 594 |
| Zillow YoY | -7.41% |
| Property Tax Rate | 0.72% (~$3,814/year) |
The Investor Profile:
The revenue looks solid ($28K annually), but purchase prices pull yields down. That -7.41% YoY price movement could signal opportunity for patient buyers… or it could mean the market is correcting from inflated COVID-era pricing. Either way, be careful about overpaying for a "view premium" that doesn't translate to proportionally higher revenue.
Lake Arrowhead sits close to LA, which provides a large potential guest pool. But at 29% occupancy, the market clearly runs seasonal.
For a broader view of California opportunities, see our guide to Airbnb markets in California.
Best for:
-
Buyers who want a higher-end product but still care about cash-flow math
-
Operators who can lift ADR and occupancy through strategic upgrades and marketing
Watch-outs:
-
Don't buy a "pretty" house that underperforms. Buy a house that guests will actually pay a premium for.
-
Model insurance and maintenance realistically. Waterfront plus mountain-adjacent can mean non-trivial costs.
Next Step: Review the Lake Arrowhead dashboard and run projections with the ROI calculator. Explore 1031 exchange into Lake Arrowhead for tax-advantaged entry.
Lake Ozark MO: Low Occupancy Value Play
The profile: Lower yield (4.79%) and the lowest occupancy in the set (25%), with low property tax (0.53%). This can be a "value-add occupancy" bet for the right operator.
January 2026 Snapshot:
| Metric | Value |
|---|---|
| Average Home Price | $333,833 |
| Annual Revenue | $16,005 |
| Gross Yield | 4.79% |
| Cap Rate | 2.88% |
| ADR | $253 |
| Occupancy | 25% |
| Active Listings | 530 |
| Zillow YoY | -2.55% |
| Property Tax Rate | 0.53% (~$1,769/year) |
The Investor Profile:
If your strategy is "buy and let the market do the work," this profile is tough. 25% occupancy doesn't leave much margin for error. But if your strategy is "find the right property and operate better than average," there may be room to outperform.
Low taxes help the net numbers, and 530 listings means less competition than Osage Beach or Lake Havasu. The question is whether you can move occupancy up through better marketing, minimum-stay strategy, and midweek fills.
① Best for:
-
Experienced operators who know how to drive occupancy
-
Investors who like low taxes and are willing to actively work the deal
② Watch-outs:
-
Low occupancy plus waterfront maintenance can become a cash drain if you under-reserve
-
Your property needs clear differentiation to stand out among 500+ options
Next Step: Dig into the Lake Ozark dashboard and explore STR setup resources for operations help. See 1031 exchange opportunities at Lake Ozark.
Lake Havasu City AZ: Scale Market with Fierce Competition
The profile: Lower yield (4.64%) with the highest active listings (1,247) and the lowest property tax rate (0.51%). Big market, big competition.
January 2026 Snapshot:
| Metric | Value |
|---|---|
| Average Home Price | $456,716 |
| Annual Revenue | $21,201 |
| Gross Yield | 4.64% |
| Cap Rate | 2.79% |
| ADR | $267 |
| Occupancy | 36% |
| Active Listings | 1,247 |
| Zillow YoY | -2.76% |
| Property Tax Rate | 0.51% (~$2,329/year) |
The Investor Profile:
Lake Havasu is a scale market. With 1,247 active listings, you're swimming in a big pool. Lots of comps means easier valuation, but it also means a lot of "same-y" inventory competing for the same guests. For a statewide view, check our guide to Airbnb markets in Arizona.
If you can design a property that stands out and run tight operations, you can compete. If you're planning to list something average and hope for the best, you'll end up fighting price wars with everyone else.
Best for:
-
Portfolio builders who excel at differentiation (design, amenities, positioning)
-
Operators who can systematize cleaning and maintenance at scale
Watch-outs:
-
High competition magnifies small mistakes (slow response times, mediocre photos, weak amenity stack)
-
Don't underwrite assuming you'll immediately match top performers. Earn it.
Next Step: Explore the Lake Havasu City dashboard, then connect with a local agent who knows the waterfront market. 1031 exchange into Lake Havasu City is popular with Arizona investors.
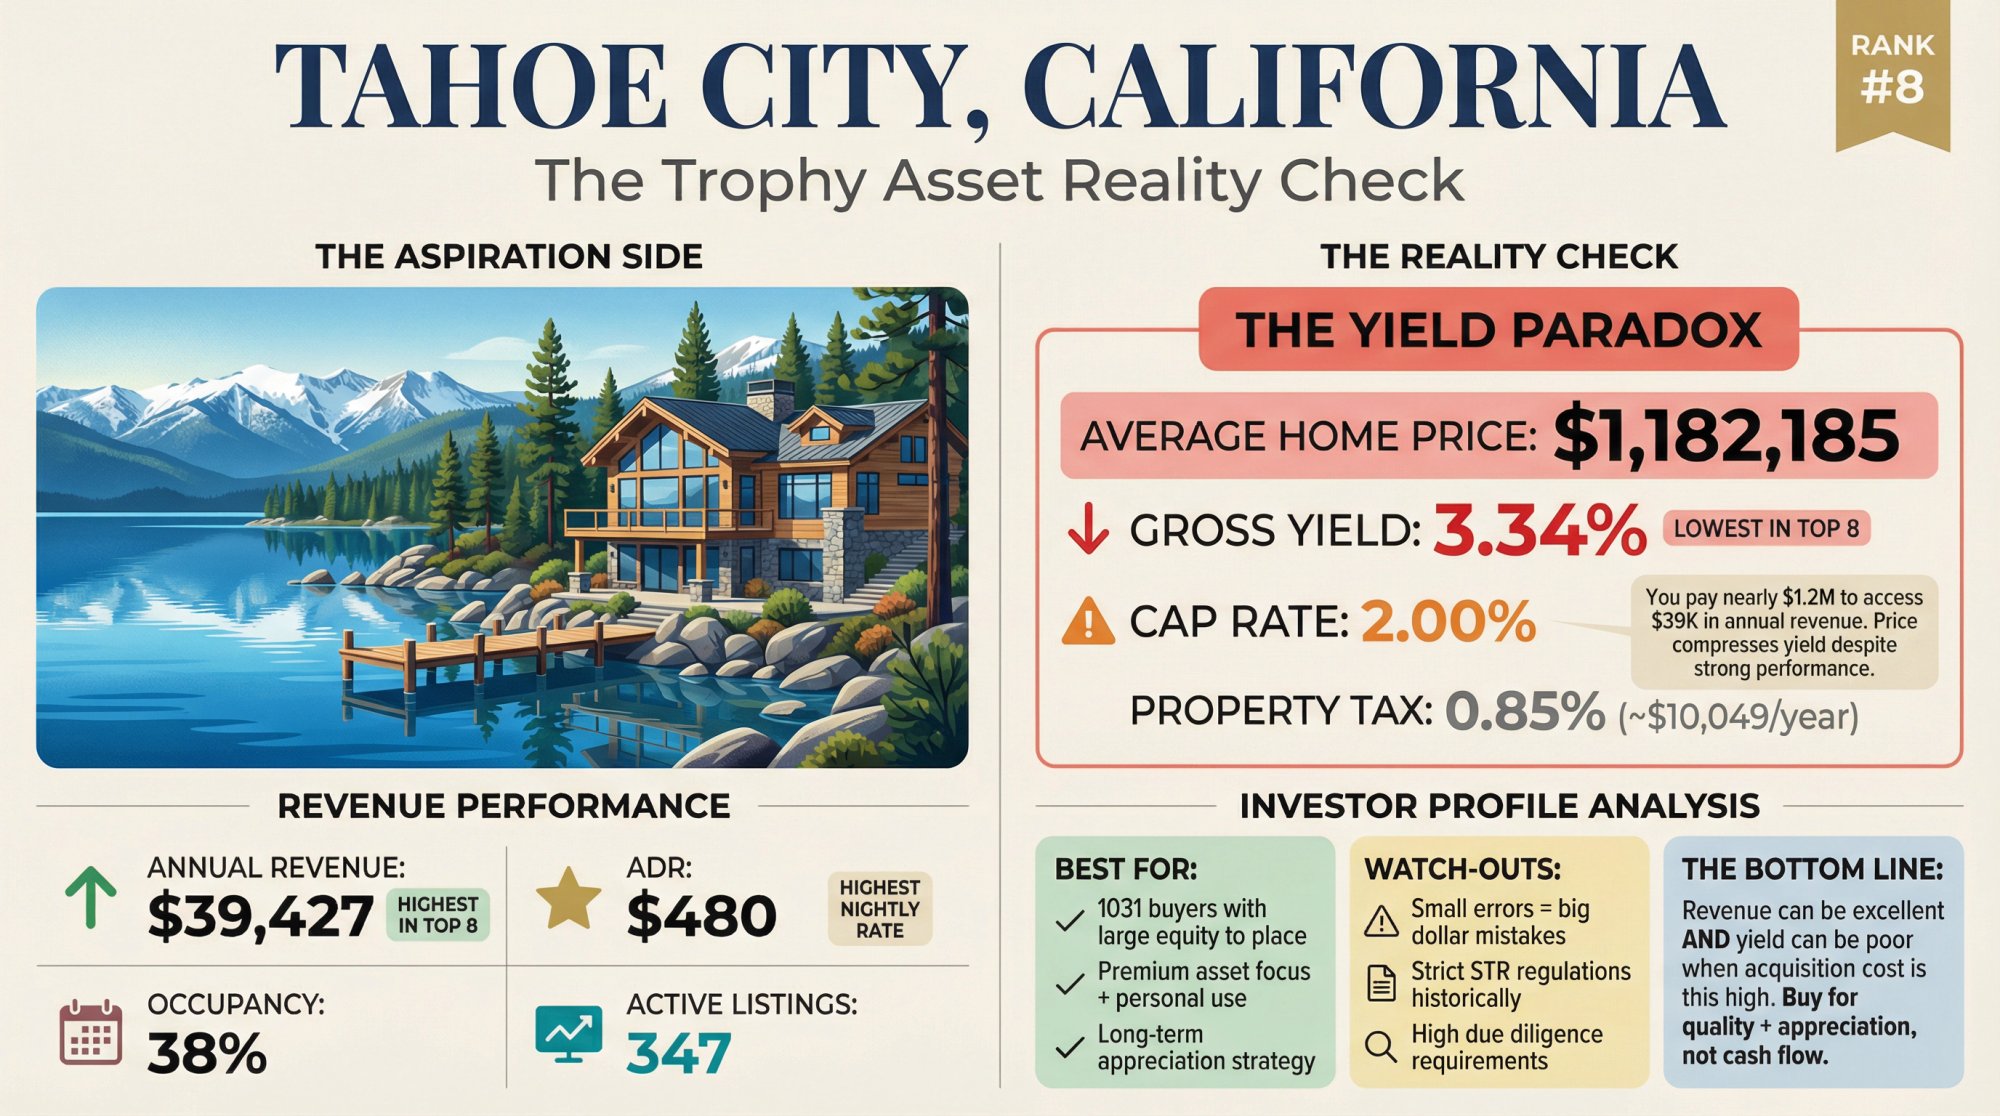
Tahoe City CA: Trophy Asset Reality Check
The profile: Highest ADR ($480) and highest annual revenue ($39,427), but the lowest gross yield (3.34%) because the average home price is by far the highest ($1.18M). This is the trophy asset reality check.
January 2026 Snapshot:
| Metric | Value |
|---|---|
| Average Home Price | $1,182,185 |
| Annual Revenue | $39,427 |
| Gross Yield | 3.34% |
| Cap Rate | 2.00% |
| ADR | $480 |
| Occupancy | 38% |
| Active Listings | 347 |
| Zillow YoY | -0.22% |
| Property Tax Rate | 0.85% (~$10,049/year) |
The Investor Profile:
Tahoe City illustrates the core tension in waterfront investing:
Revenue can be great and the deal can still be "low yield" because price is so high.
You buy into this profile when you care about factors beyond pure yield. Asset quality, personal use value, and long-term appreciation potential often drive Tahoe purchases more than cash-flow math. And if you're doing a 1031 exchange with significant equity to place, premium markets like this become more relevant.
→ Best for:
-
1031 buyers who need to place larger equity and want premium assets
-
Investors prioritizing high-end guest profiles and long hold periods
-
Buyers who value personal use alongside rental income
→ Watch-outs:
-
At this price level, small underwriting errors become big dollar mistakes
-
Don't skip regulation checks or due diligence shortcuts. Tahoe has historically had strict STR rules.
Next Step: Connect with Tahoe City agents who specialize in STR properties, then stress-test deals with the ROI calculator. See 1031 exchange options in California.
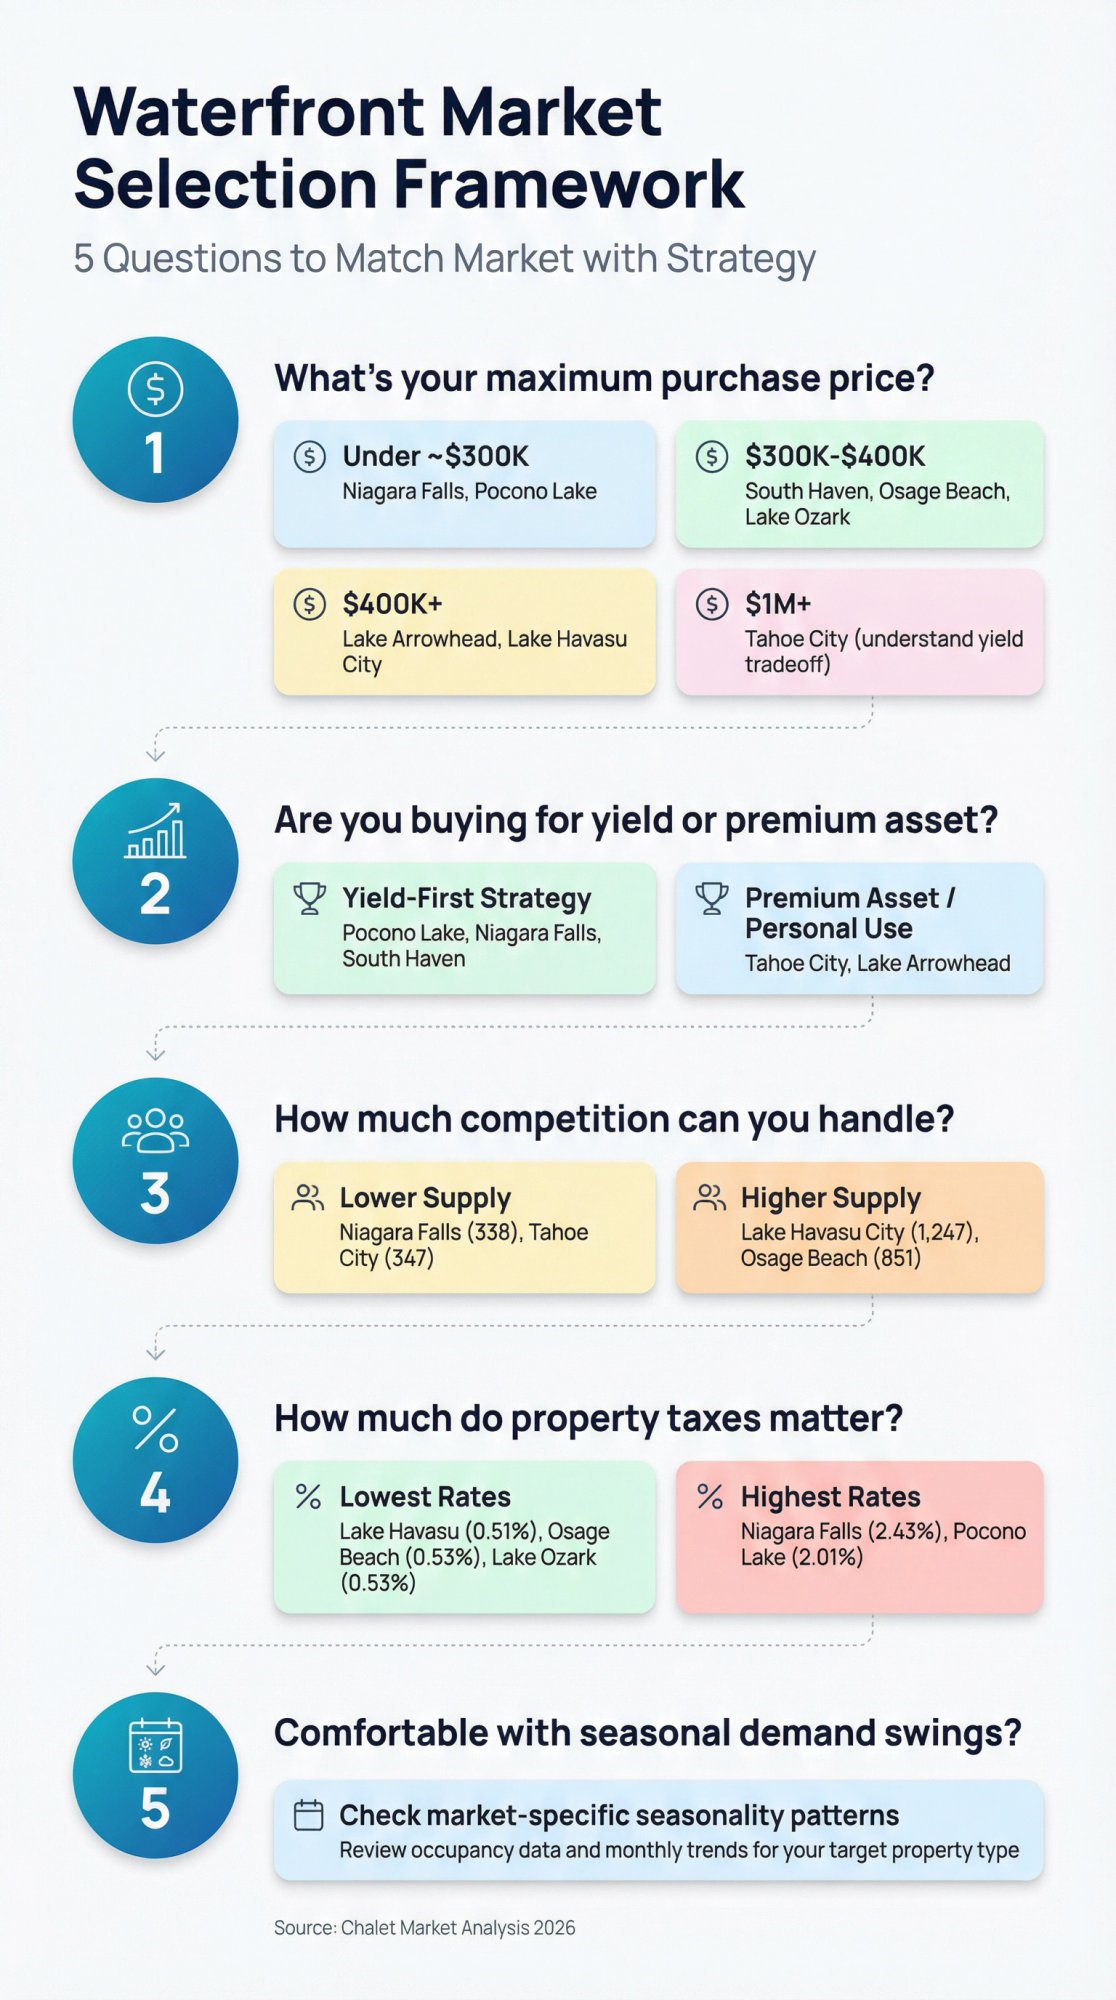
How to Pick the Right Waterfront Market for Your Strategy
If you need to narrow your search quickly, run through this decision filter:
① What's your maximum purchase price?
-
Under ~$300K (based on averages): Start with Niagara Falls or Pocono Lake
-
$300K-$400K range: South Haven, Osage Beach, Lake Ozark. See our budget-friendly Airbnb rental markets guide
-
$400K+: Lake Arrowhead, Lake Havasu City
-
$1M+: Tahoe City (but understand the yield tradeoff). Explore luxury Airbnb rental markets
② Are you buying for yield or for a premium asset?
| Priority | Markets to Consider |
|---|---|
| Yield-first | Pocono Lake, Niagara Falls, South Haven |
| Premium asset / personal use balance | Tahoe City, Lake Arrowhead |
③ How much competition can you handle?
-
Lower supply (in this set): Niagara Falls (338), Tahoe City (347)
-
Higher supply: Lake Havasu City (1,247), Osage Beach (851)
④ How much do property taxes matter in your model?
-
Lowest rates: Lake Havasu City (0.51%), Osage Beach (0.53%), Lake Ozark (0.53%)
-
Highest rates: Niagara Falls (2.43%), Pocono Lake (2.01%)
⑤ Are you comfortable with seasonal demand swings?
Occupancy percentages give you a clue, but your real answer comes from understanding each market's seasonality pattern and how your specific property type performs. Use Chalet's dashboards to dig into monthly trends.
Waterfront Property Underwriting Checklist
Waterfront deals fail for boring reasons. Use this checklist to avoid them.
Revenue Side (Make It Real)
-
Don't assume your property hits market-average ADR on day one. New listings typically underperform until reviews build.
-
Check if your layout supports group stays. Bedroom count is a huge revenue driver for lake houses.
-
Plan for shoulder season. If your property has nothing to offer when it's cold, rainy, or too hot, occupancy drops hard.
-
Underwrite with a "base case" and a "bad weather / bad reviews" case. See what happens to your numbers.
Expense Side (Waterfront-Specific)
Waterfront properties often add expenses you don't see in typical suburban STRs:
-
Higher utilities (guests run heat and AC harder at vacation rentals)
-
More exterior upkeep (decks, stairs, railings, docks, erosion control)
-
Moisture-related wear (mold prevention, dehumidifiers, HVAC maintenance)
-
Higher repair velocity (guests plus water plus outdoor gear equals more stuff breaking)
-
Specialized cleaning (sand, mud, lake smell, hot tubs)
Financing Reality (Especially for First-Timers)
A lot of investors get surprised by this: cap rate is calculated before mortgage payments.
Your lender cares about DSCR (debt service coverage ratio):
DSCR = Net Operating Income / Annual Debt Payments
A property can look great on cap rate and still not qualify for financing if the DSCR is too tight. That's why you should underwrite specific addresses with your actual financing assumptions. Chalet's calculator lets you do exactly that. Learn more about how to qualify for a DSCR loan and explore short-term rental loans in 2025.
1031 Exchange Timeline for Waterfront Properties
Waterfront properties add moving parts. If you're executing a 1031 exchange, you need speed-to-operate, not "we'll figure it out after closing."
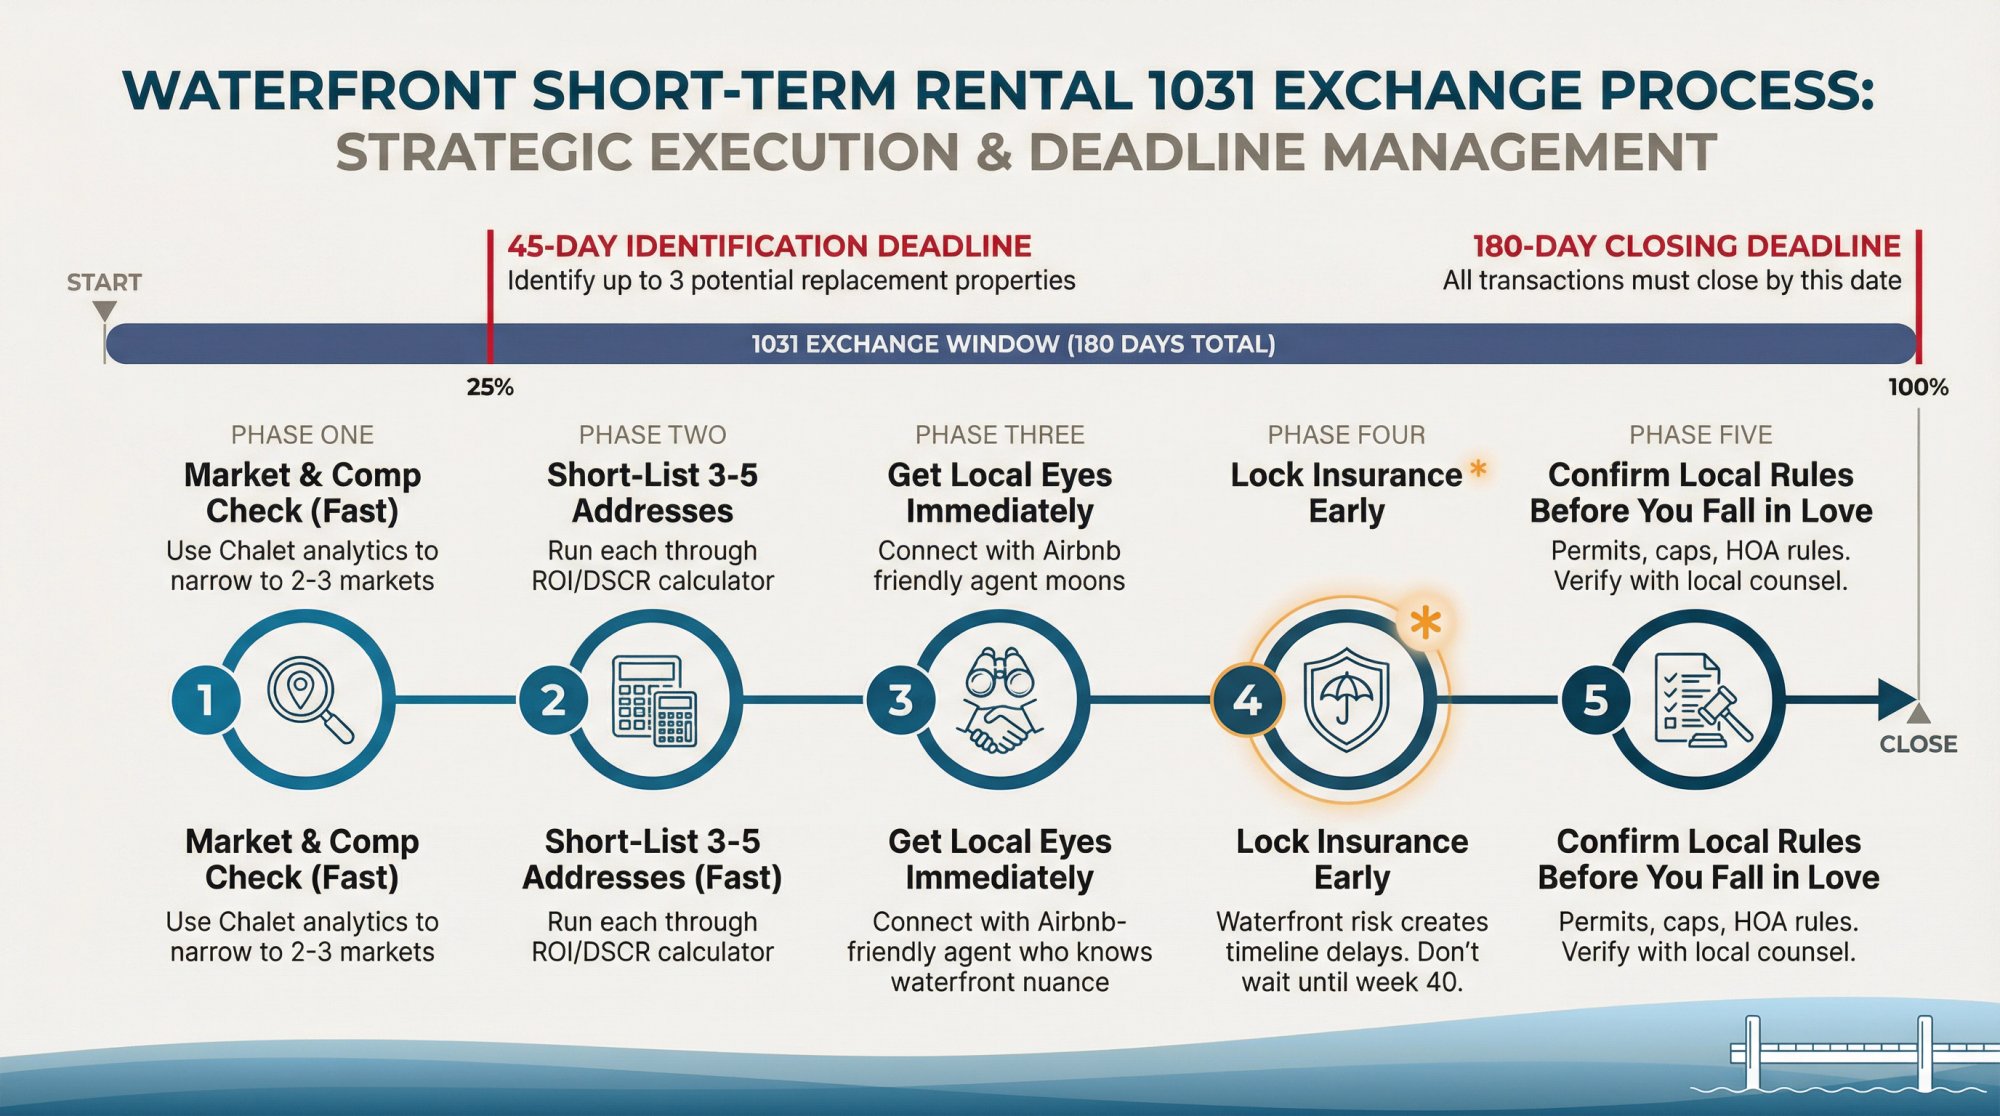
Here's an execution stack that works:
① Market and comp check (fast): Use Chalet's analytics to narrow to 2-3 markets
② Short-list 3-5 addresses (fast): Run each through the ROI/DSCR calculator
③ Get local eyes immediately: Connect with an Airbnb-friendly agent who knows waterfront nuance
④ Lock insurance early: Waterfront risk can create its own timeline delays. Don't wait until week 40.
⑤ Confirm local rules before you fall in love: Permits, caps, HOA rules. Start with Chalet's regulation library and verify with local counsel.
For more on 1031 exchange timelines and how to use them for transitioning from long-term to short-term rentals, see our detailed guides.
How to Win in Crowded Waterfront Markets
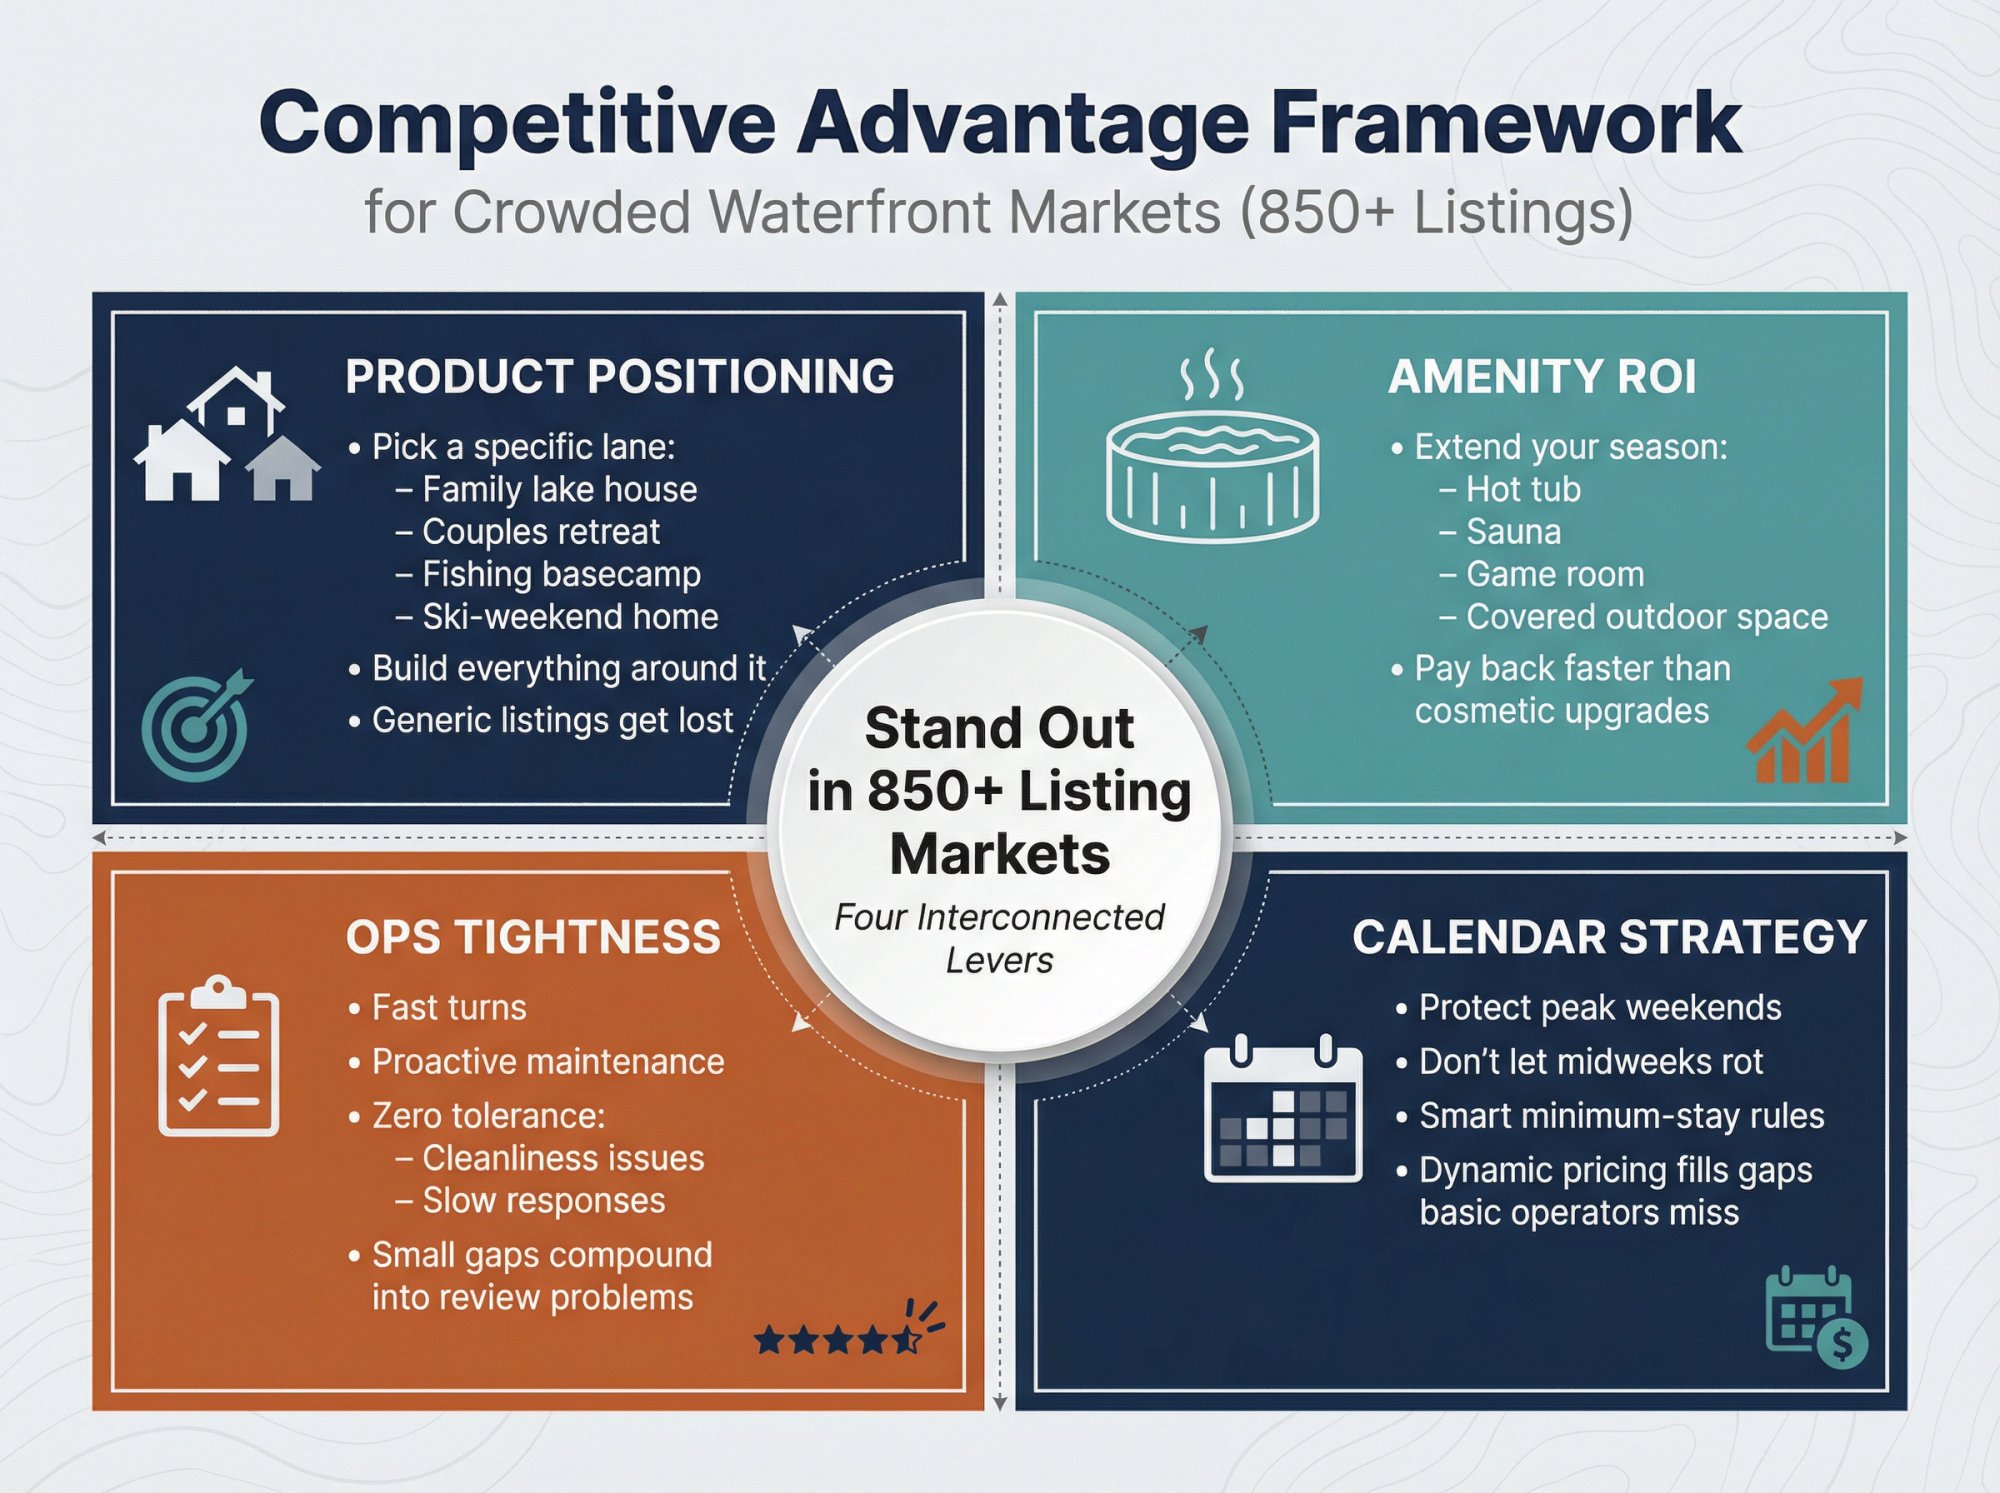
If you're operating in markets with 850+ listings, you win by being the obvious best choice for a specific guest profile.
A few levers that actually move the needle:
Product positioning: Pick a lane (family lake house, couples retreat, fishing basecamp, ski-weekend home) and build everything around it. Generic listings get lost in the scroll.
Amenity ROI: Invest where it extends your season. Hot tub, sauna, game room, covered outdoor space. These pay back faster than cosmetic upgrades.
Ops tightness: Fast turns, proactive maintenance, zero tolerance for cleanliness issues. At scale, small operational gaps compound into big review problems. Consider whether self-managing your short-term rental makes sense for your portfolio.
Calendar strategy: Protect peak weekends, but don't let midweeks rot. Smart minimum-stay rules and dynamic pricing can fill gaps that basic "weekend only" operators leave on the table.
Need help building your operator stack? Chalet's vendor directory connects you with property managers, cleaners, furnishing services, and more.
How Chalet Helps Waterfront STR Investors
Chalet is built specifically for short-term rental investors. We combine free analytics with a vetted vendor network so you can research, buy, and operate in one place.
For Market Research:
Our free market dashboards show you ADR, occupancy, revenue trends, and active listing counts across hundreds of markets. No paywall, no subscription.
For Property Underwriting:
The ROI and DSCR calculator lets you model specific addresses with your financing assumptions. See projected cash flow, cap rate, and debt coverage before you make an offer. It's the best Airbnb calculator available for investors.
For Finding the Right Team:
We maintain a network of STR-specialist real estate agents, lenders who understand DSCR loans, insurance providers who handle waterfront properties, and property managers who actually know vacation rental operations.
For Getting Operational:
Our STR directory covers cleaning, furnishing, cost segregation, and more. Everything you need to go from closing to live listing.
Frequently Asked Questions
Frequently Asked Questions
What's the difference between gross yield and cap rate?
Gross yield is your top-line return: annual revenue divided by purchase price. Cap rate factors in operating expenses: net operating income (revenue minus expenses) divided by price. Cap rate is closer to reality, but it still doesn't include your mortgage payment. For the full picture, you need to model DSCR. Use our DSCR calculator to run the numbers.
Should I buy purely based on this list?
No. Use it to pick 2-3 markets worth researching deeply. Then underwrite specific addresses. Waterfront properties vary wildly even within the same zip code. A lakefront lot with a dock and a "lake access" property three blocks away will have completely different performance profiles.
Why do some "high revenue" markets have low yield?
Because price matters more than revenue alone. If you pay 30x annual revenue for a property, you won't get a high yield unless that revenue is absurdly high or you bought at a discount. Tahoe City generates almost $40K in annual revenue but still shows the lowest yield in this set because the average home price is nearly $1.2M.
What's the single best next step if I'm serious about waterfront investing?
Pick one market from the table and run the math on real listings. Browse Airbnb rentals for sale, then stress-test your favorites with the ROI calculator. Numbers on real properties beat abstract market averages every time.
Are waterfront properties harder to finance than regular STRs?
Sometimes. Waterfront adds complexity around insurance, flood zones, and appraisal comparables. DSCR lenders are generally comfortable with STRs, but you'll want to confirm any property-specific quirks early. Chalet's lender network includes DSCR specialists who handle these deals regularly.
How do I check STR regulations before buying?
Start with Chalet's rental regulations library for an overview, then verify directly with local planning and zoning. Rules vary by city, county, and sometimes even by HOA. Never assume a property is STR-legal without confirming.
Next Steps
If you want to move from "interesting list" to "ready to buy," work through this sequence:
① Pick 2 markets from the table and review the detailed numbers. Analyze markets
② Underwrite 3-5 addresses in each market. Run ROI/DSCR for specific properties
③ Get a local pro involved early (waterfront knowledge matters). Meet an Airbnb-friendly agent
④ Build your operator stack before closing. Set up STR operations
Chalet is the one-stop platform for short-term rental investors. We pair free market analytics with a vetted vendor network (agents, lenders, insurance, property managers, and more) so you can research, buy, and operate in one place.