Written by: Ashley Durmo
Our March 2025 analysis of short-term rental markets reveals compelling insights into trends and shifts that investors should consider. Utilizing proprietary data collection, machine learning algorithms, and public data sources like Airbnb calendars, Zillow, and MLS, we evaluated full-time Airbnb listings (those available over 180 days annually). Here are the key takeaways:
Percentage of Markets with MoM Revenue Growth
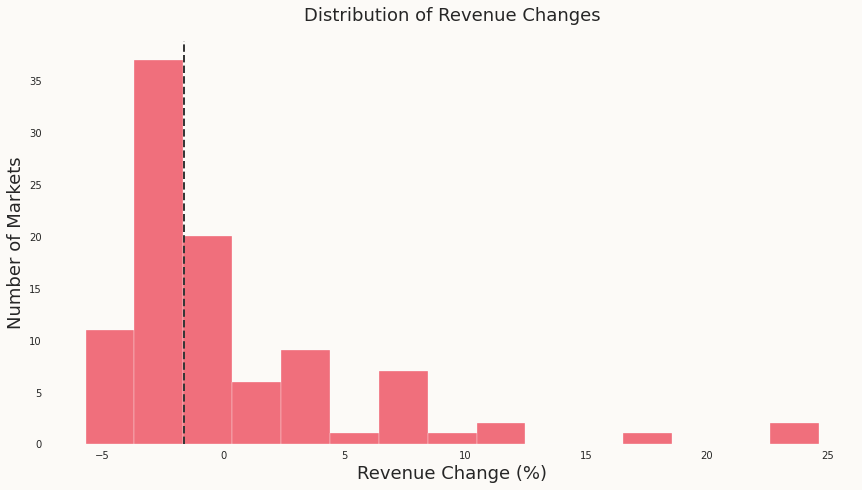
Approximately 33.0% of short-term rental markets experienced month-over-month revenue growth in March 2025, highlighting strong seasonal performance in select areas.
The majority of the markets, however, experienced a revenue decline. See below which markets experienced the biggest change.
Percentage of Markets with MoM Occupancy Growth
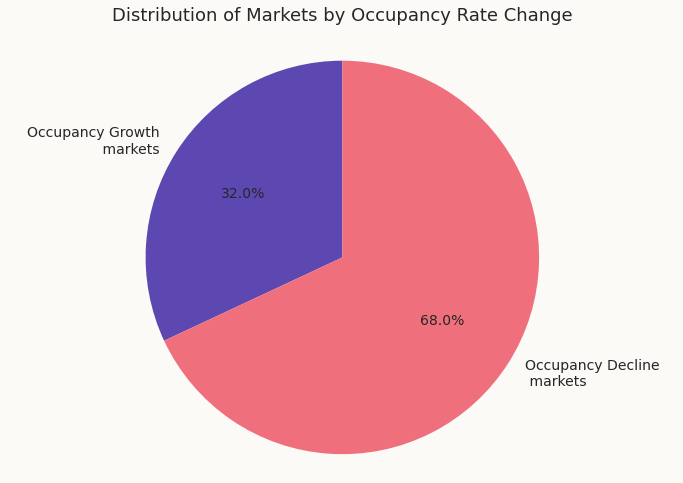
Roughly 32.0% of Airbnb rental markets showed occupancy growth compared to November, reflecting stable or increasing demand in these locations.
Percentage of Markets with Zillow YoY Home Value Decline
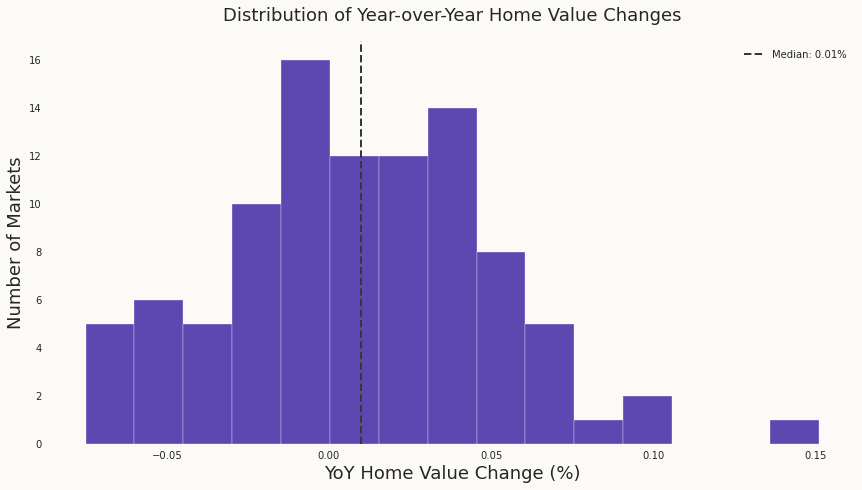
Around 43.3% of short-term rental markets experienced a year-over-year decline in home values, potentially offering attractive buying opportunities for long-term investors.
The median home value change for the markets Chalet is live in was only 0.01%.
Additional Insights
Top 5 Markets by Gross Yield Ranking Improvement
Ranking improvement highlights markets where short-term rental conditions have become more favorable. It is calculated by analyzing changes in median gross yield, which may drive declining home prices, rising revenues, or a combination of both factors.
- Island Park: ⬆️ (current ranking 55, previous ranking 71)
- Miramar Beach: ⬆️ 11 (current ranking 65, previous ranking 76)
- Banner Elk: ⬆️ 11 (current ranking 55, previous ranking 71)
- Bradenton Beach: ⬆️ 9 (current ranking 66, previous ranking 75)
- Panama City Beach: ⬆️ 7 (current ranking 42, previous ranking 49)
Island Park saw the most significant improvement, signaling enhanced investment conditions or demand growth.
Top 5 Markets by Median Gross Yield
Gross yield measures rental income relative to property prices, an essential metric for investors seeking high returns.
- Detroit: 41.72%
- Cleveland: 29.50%
- South Bend: 28.19%
- Birmingham: 24.29%
- Memphis: 23.05%
Detroit and Cleveland’s impressive yields highlight these cities’ strong income potential relative to property values.
Top 5 Markets by Median Annual Revenue
Markets with the highest median annual revenue indicate lucrative investment opportunities.
- Key West: $103,633
- Vail: $92,646
- Pigeon Forge: $79,175
- Charleston: $78,904
- Park City: $78,079
Key West remains a standout performer, attracting consistent demand and delivering exceptional revenue.
Top 5 Markets by Zillow YoY Home Value Change
Markets with strong home value appreciation signal growing investor interest and economic activity.
- Atlantic City: +15.10%
- Cleveland: +9.33%
- Detroit: +9.12%
- Vail: +7.60%
- Charleston: +6.61%
Atlantic City leads with the highest appreciation, reflecting increased desirability and investment.
Top 500 Airbnb Rental Markets

Instantly compare the top 500 short-term (Airbnb) rental markets in the US
Bottom 5 Markets by Zillow YoY Home Value Change
These markets saw the steepest declines in home values, which may signal buying opportunities for long-term investors.
- Broken Bow: -7.51%
- Bradenton Beach: -7.16%
- Gatlinburg: -6.74%
- New Orleans: -6.44%
- Destin: -6.05%
Broken Bow’s decline suggests a cooling market, potentially creating entry points for investors.
Top 5 Markets by Revenue Growth Percentage (MoM)
These markets experienced significant month-over-month growth in revenue, showcasing robust seasonal demand.
- Banner Elk: +11.74%
- Miramar Beach: +10.95%
- Hilton Head Island: 9.81%
- Park City: 7.56%
Saint Louis and Gulf Breeze excelled with dramatic revenue growth during the holiday season.
Top 5 Markets Where Revenue Dropped the Most (MoM)
Some markets experienced revenue declines, likely due to seasonality or shifting travel patterns.
- Augusta: -5.70%
- Charlottesville: -5.21%
- Joshua Tree: -5.00%
- Blue Ridge: -4.40%
- Yucca Valley: -4.22%
Joshua Tree’s decline aligns with reduced tourism in colder months, emphasizing the need to account for seasonality.
Conclusion
Our March 2025 analysis underscores the diversity in market trends:
- High-Yield Opportunities: Cities like Detroit and Cleveland offer exceptional gross yields.
- Seasonal Trends: Markets like Saint Louis show robust holiday demand, while Joshua Tree reflects seasonal slowdowns.
- Investment Opportunities: Declining home prices in markets such as Broken Bow may present long-term value.
Stay ahead of market trends with our data-driven insights, empowering you to make informed investment decisions.