Written by: Sanjin Hadziomerovic
The short-term rental (STR) market is constantly evolving, and as we step into 2025, our latest analysis reveals valuable insights for real estate investors. By leveraging proprietary data from Airbnb calendar tracking, Zillow, and MLS insights, we’ve explored key trends for full-time Airbnb listings available more than 180 days a year.
Key Market Trends and Insights
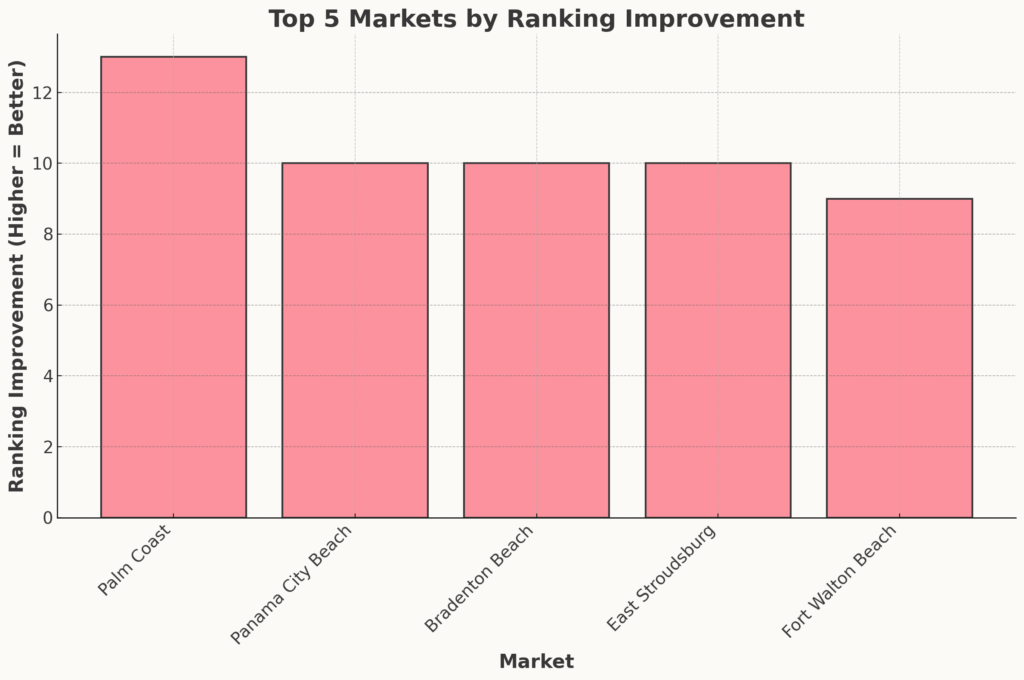
1. Ranking Improvements Across Markets
The greatest ranking improvements were observed in:
- Palm Coast: Improved by 13 spots (ranked 33rd as of March 2025)
- Panama City Beach: Improved by 10 spots (ranked 32nd as of March 2025)
- Bradenton Beach: Improved by 10 spots Improved by 10 spots (ranked 56th as of March 2025)
- East Stroudsburg: Improved by 10 spots (ranked 73rd as of March 2025)
- Fort Walton Beach: Improved by 9 spots (ranked 13th as of March 2025)
These improvements often reflect rising investor interest, increased profitability, or seasonal demand shifts. Markets like Blue Ridge and Joshua Tree, known for their scenic appeal, have likely benefited from targeted marketing or improved tourism infrastructure.
2. Gross Yield Leaders
Gross yield remains a critical metric for investors. The top-performing markets in March 2025 were:
- Detroit: 41.72%
- Cleveland: 29.50%
- South Bend: 28.19%
- Birmingham: 24.29%
- Memphis: 23.05%
These markets exhibit strong returns relative to property prices, often driven by affordable home prices and steady rental demand. For example, Detroit’s high gross yield reflects its affordability combined with consistent rental revenue.

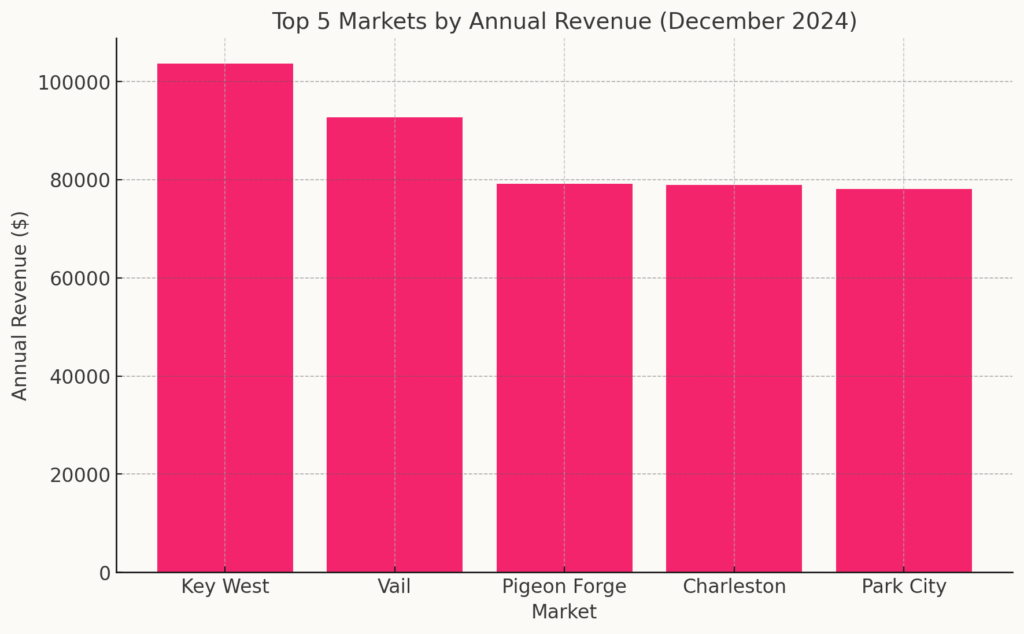
3. Annual Revenue Giants
Some markets generated exceptional median annual revenues in December:
- Key West: $103,633
- Vail: $92,646
- Pigeon Forge: $79,176
- Charleston: $78,905
- Park City: $78,080
These markets typically cater to high-spending tourists or feature premium accommodations. Key West and Vail, for instance, capitalize on their year-round appeal and affluent visitors.
4. Revenue Growth vs. Decline
Out of all the markets analyzed:
- 50.5% experienced revenue growth.
- 49.5% saw a revenue drop.
The chart below illustrates this split, showcasing the resilience of most markets even as seasonality impacted others.

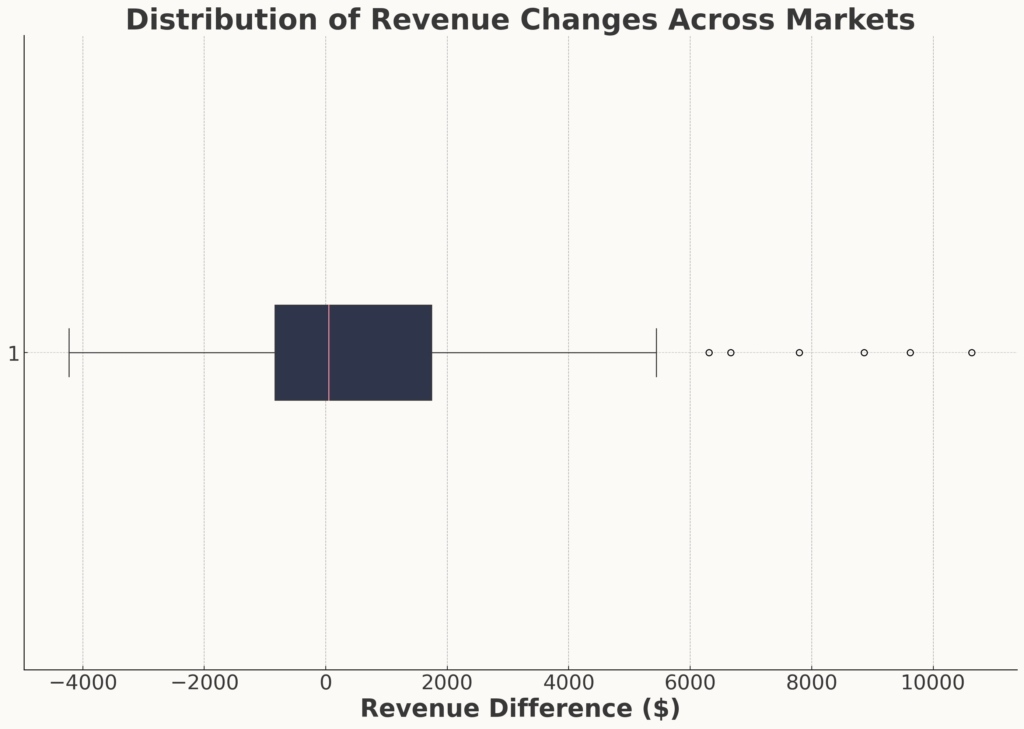
5. Distribution of Revenue Changes
A box plot of revenue changes across markets reveals the variability in performance:
- Outliers: Markets like Park City and Banner Elk showed significant revenue growth, while Lake Arrowhead and Blue Ridge saw notable declines.
- Median Change: Most markets experienced modest fluctuations, highlighting stable demand.
Top 500 Airbnb Rental Markets

Instantly compare the top 500 short-term (Airbnb) rental markets in the US
6. Home Value Trends
Home value appreciation or depreciation often signals broader market health. Here’s how markets fared:
- Positive Home Value Change: 58% of markets saw home values rise, with leaders like Atlantic City (+15.10%) and Cleveland (+9.33%).
- Negative Home Value Change: 42% of markets experienced declines, led by Broken Bow (-7.51%) and Bradenton Beach (-7.16%).

Visual Insights
- Ranking Improvements: Bar charts highlight markets like Blue Ridge and Lake Arrowhead, which climbed the ranks significantly.
- Gross Yield and Annual Revenue: Separate visuals illustrate the top-performing markets for each metric, showcasing opportunities for both affordability-focused and high-revenue investors.
- Revenue Growth Distribution: A box plot reveals key outliers and medians, providing a nuanced view of market variability.
- Home Value Trends: A bar chart compares markets with rising and falling home values, offering insights into where property investments might pay off.
Investor Takeaways
- Target High-Gross-Yield Markets: Affordable markets like Detroit and Cleveland remain excellent for ROI-driven investors.
- Capitalize on Revenue Giants: Premium destinations such as Key West and Vail offer strong annual revenues, particularly for those focused on luxury STR investments.
- Watch for Opportunities in Declining Home Value Markets: Markets with falling home values, like Broken Bow and Bradenton Beach, may present buying opportunities but require caution regarding local demand trends.
- Seasonal Adjustments Matter: Markets with significant seasonal revenue changes, like Park City, suggest that timing investments carefully can maximize returns.
Conclusion
The short-term rental market in early 2025 shows diverse trends, with opportunities in high-yield, high-revenue, and appreciating home value markets. By adapting to market-specific factors and leveraging our insights, investors can position themselves for success in this competitive landscape.