
Airbnb market dataThrough 2,107 listingsHow we measure
Yes, Savannah, GA is a good Airbnb market in 2026. The median annual revenue is $47,679, with 56% occupancy and a median ADR of $248 (Chalet data).
Buying in Savannah?Free, with no obligation
Written from an earlier data window, so some figures differ from the live numbers above.
Chalet AI
A typical active Savannah Airbnb earned $47,679 in the 12 months to Sep 2026. The top 25% of listings averaged $80,889, about 1.7× that. The bottom 25%, which includes rarely booked listings, averaged $3,850.
$3.9k
Bottom 25% average
$47.7k
Typical listing
$80.9k
Top 25% average
1-bedroom homes are the most common in Savannah (35% of listings).
| Bedrooms | Share of listings | Nightly rate | Occupancy | Est. revenue/yr |
|---|---|---|---|---|
| Studio | 3% | $194 | 52% | $37,046 |
| 1 bedroom | 35% | $187 | 53% | $36,329 |
| 2 bedrooms | 27% | $254 | 54% | $49,768 |
| 3 bedrooms | 23% | $301 | 51% | $55,530 |
| 4 bedrooms |
Estimated revenue = nightly rate × occupancy × 365, last 12 months.
Have a property in mind?
Estimate its revenue, costs and cash flow with Savannah's numbers.
The best three months, Mar, Oct and Apr, brought in 31% of a typical Savannah listing's revenue over the 12 months to Sep 2026.
Mar brings in 2.0× as much as Aug
Typical monthly revenue per listing, Oct 2025–Sep 2026
| Month | Revenue | Occupancy | Nightly rate | Revenue a year earlier |
|---|---|---|---|---|
| Oct 2025 | $4,604 | 63% | $238 | |
| Nov 2025 | $3,796 | 53% | $235 | |
| Dec 2025 | $3,740 | 48% | $248 | |
| Jan 2026 | $3,137 | 44% | $219 | |
| Feb 2026 | $3,570 | 56% | $244 | |
| Mar 2026 | $5,711 | 70% | $314 | |
| Apr 2026 |
Midtown has the highest gross yield of the 12 Savannah neighborhoods we rank, at 12.1%, with typical revenue of $33,806 a year.
| # | neighborhood | Gross yield | Revenue/yr | Occupancy | Home value |
|---|---|---|---|---|---|
| 1 | Midtown | 12.1% | $33,806 | ||
| 2 | Eastside | 10.8% | $34,214 | ||
| 3 | Georgetown | 10.8% | $33,355 | ||
| 4 | Robert Hitch Village | locked | locked | locked | locked |
| 5 | Beach Institute | locked | locked | locked | locked |
| 6 | Dixon Park | locked | locked | locked | locked |
| 7 | Thomas Square | locked | locked | locked | locked |
| 8 | East Victorian District | locked | locked | locked | locked |
| 9 | West Victorian District | locked | locked | locked | locked |
and 3 more neighborhoods
Ranked by gross yield (typical yearly revenue ÷ median home value), last 12 months. 34 neighborhoods have fewer than 20 listings or incomplete data and aren't ranked.
Yield isn't everything: zoning and HOA rules decide which streets allow short-term rentals.
The median Savannah home is worth $322,239 (Zillow, Aug 2026), down 2.8% in a year. At typical revenue that's a 14.8% gross yield, before the mortgage, taxes and running costs.
Yes, Airbnbs are legal in Savannah with a required city-issued STVR certificate and business license.
Yes, you need both a Short-Term Vacation Rental (STVR) certificate and a Business Tax Certificate to operate an Airbnb in Savannah.
Yes, private covenants such as HOA or condo rules are not overridden by city-issued STR permits.
The total lodging tax rate for STRs in Savannah includes an 8% city hotel/motel tax, a $5/night state fee, and a 4% state sales tax.
The 10 largest operators in Savannah each ran 23 or more listings as of May 2025.
and 3 more
Of guests from the top 10 cities, 83% live within a day's drive. Guests book 63 days ahead on average.
and 3 more
Savannah ranks #3 of the 12 Georgia markets we track by gross yield.
| # | Market | Gross yield | Revenue/yr | Home value |
|---|---|---|---|---|
| 1 | Columbus, GA | 24.0% | $42,290 | |
| 2 | Augusta, GA | 15.4% | $29,045 | |
| 3 | Savannah, GA (this market) | 14.8% | $47,679 | |
| 4 | Helen, GA | 13.2% | $43,788 | |
| 5 | Ellijay, GA | 12.7% | $50,741 | |
| 6 | Decatur, GA | 12.4% | $34,763 | |
| 7 | Athens, GA | 11.0% | $37,546 | |
| 8 | Blue Ridge, GA | 11.0% | $56,455 |
None listed in Savannah right now, so here are others in Georgia.
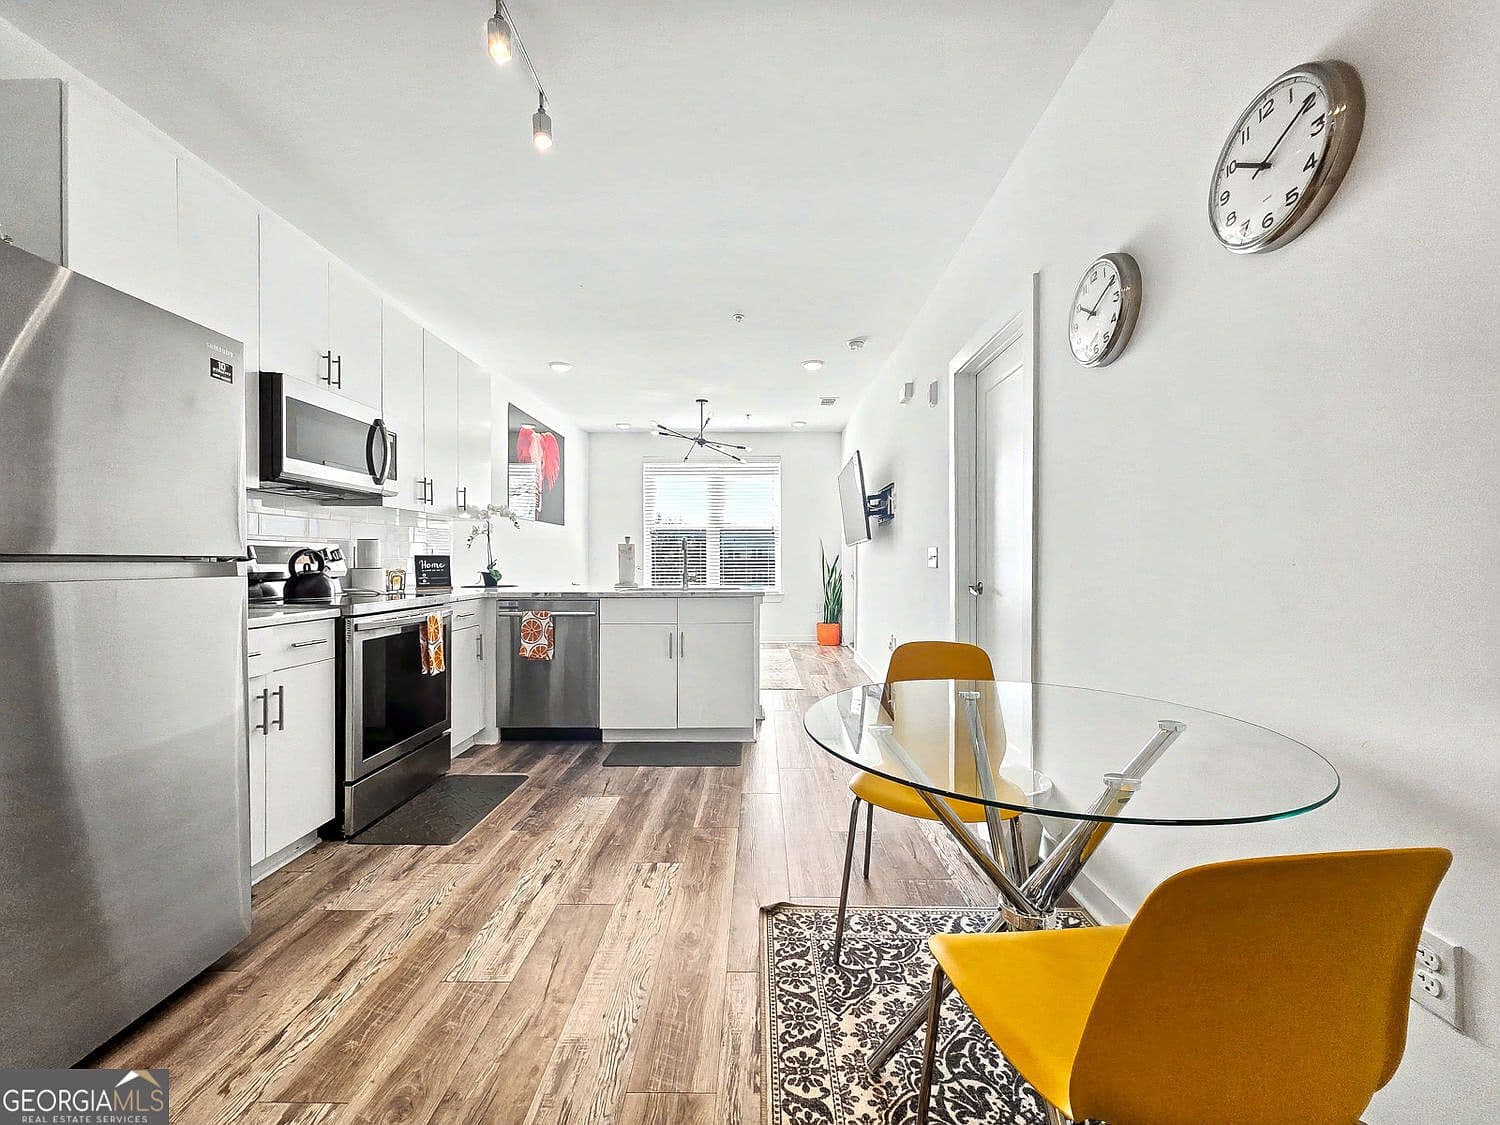
$250,000
525 Parkway Dr NE #404, Atlanta, GA, 30308
1 bd · 1 ba · 1,314 sq ft
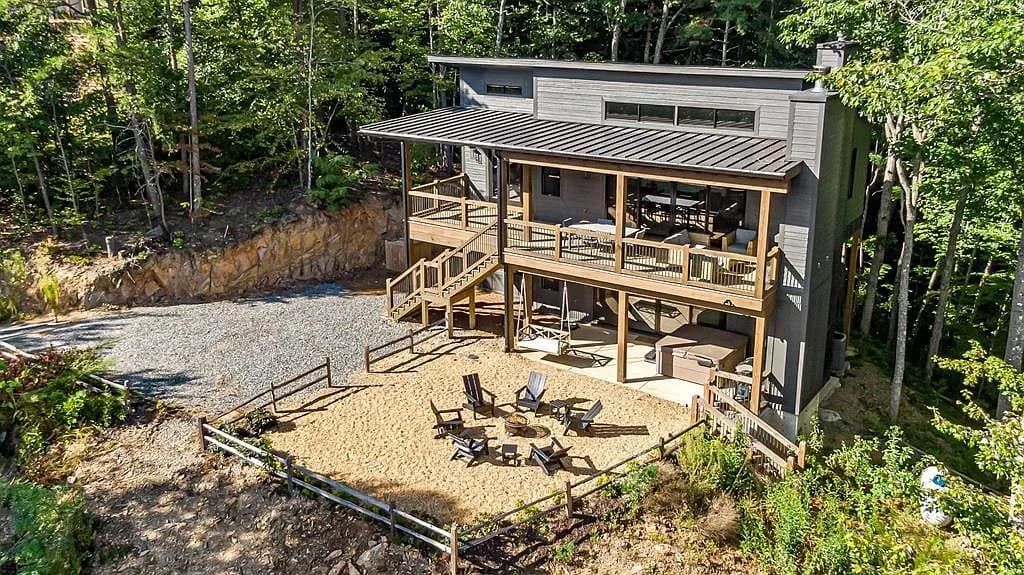
$1,290,000
351 S Dream Catcher, Blue Ridge, GA 30513
4 bd · 5 ba · 2,676 sq ft
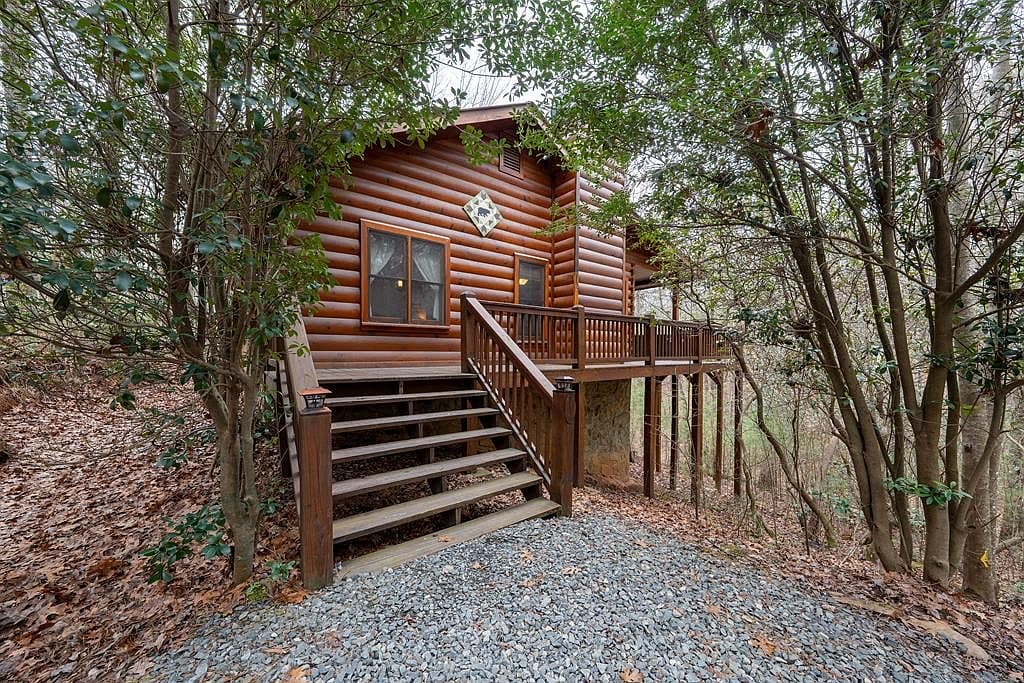
$374,900
1165 Little Bushy Head Rd, Blue Ridge, GA, 30513
2 bd · 2 ba · 892 sq ft
Buying here?
A Savannah STR agent knows which properties and streets work as short-term rentals.
Selling a Savannah Airbnb?
Get matched with a listing agent who sells short-term rentals here.
Need financing?
DSCR lenders qualify you on the property's projected rental income.
A typical active Airbnb in Savannah, GA earned $47,679 in the 12 months to Sep 2026. The median listing was booked 56% of nights, and the average nightly rate was $248 in Sep 2026. Against a median home value of $322,239, that's a 14.8% gross yield before the mortgage, taxes and running costs.
A typical active listing earned $47,679 in the 12 months to Sep 2026. The top 25% of listings averaged $80,889 and the bottom 25% $3,850. Estimated by size: 1-bedroom about $36,329; 2-bedroom about $49,768; 3-bedroom about $55,530 and 4-bedroom about $86,854 a year.
The typical listing was booked 56% of nights in the 12 months to Sep 2026, from 70% in March to 39% in August.
March; October and April earned the most, bringing in 31% of a typical listing's revenue in the 12 months to Sep 2026.
$322,239 as of August 2026 (Zillow Home Value Index), down 2.8% in a year.
1-bedroom homes make up 35% of listings, earning an estimated $36,329 a year.
The top origin cities are Atlanta, GA (4.8% of guests); New York, NY (1.9% of guests) and Charlotte, NC (1.8% of guests). Of guests from the top 10 cities, 83% live within a day's drive.
Chalet tracks 2,107 short-term rental listings in Savannah, GA, with data through Sep 2026.
Based on 2,107 Savannah short-term rental listings tracked by Chalet, with data through Sep 2026. Home values come from the Zillow Home Value Index.
Airbnb data sites count different things. Some average every listing, including ones that are rarely booked; some use a whole metro area instead of the town; some use a calendar year. We show typical figures for active listings in Savannah over the last 12 months, and label each number with what it counts. Compare like with like before comparing sites.
For education only, not financial, legal or investment advice. Full methodology
| $456 |
| 52% |
| $86,854 |
| 5 bedrooms | 3% | $573 | 44% | $91,608 |
|---|
| $4,382 |
| 67% |
| $288 |
| May 2026 | $4,231 | 60% | $285 |
|---|
| Jun 2026 | $3,856 | 59% | $262 |
|---|
| Jul 2026 | $4,165 | 61% | $254 |
|---|
| Aug 2026 | $2,885 | 39% | $232 |
|---|
| Sep 2026 | $3,602 | 52% | $256 |
|---|