


The two GOATs’ final World Cup is moving the needle: every Argentina and Portugal group game lifted local Airbnb occupancy, and they’re the biggest gainers in the data. Yet across 9 of 10 US host cities, bookings are still tracking below last summer. Here’s the split-screen.
Here is the strange shape of the 2026 World Cup, told through Airbnb bookings: in the cities where Lionel Messi and Cristiano Ronaldo are playing their final World Cup group games, occupancy is climbing. Almost everywhere else, it’s falling.
According to short-term-rental data analyzed by Chalet, Airbnb occupancy across the June group-stage window is running below the comparable period a year earlier in 9 of the 10 US host cities we could measure. The mega-event isn’t filling rooms that were empty before. In most of these markets, fewer listings are booked than were booked last June.
But the two biggest names in the sport are bending their local markets the other way — and the data says so plainly.
The GOAT effect is real, and it’s measurable
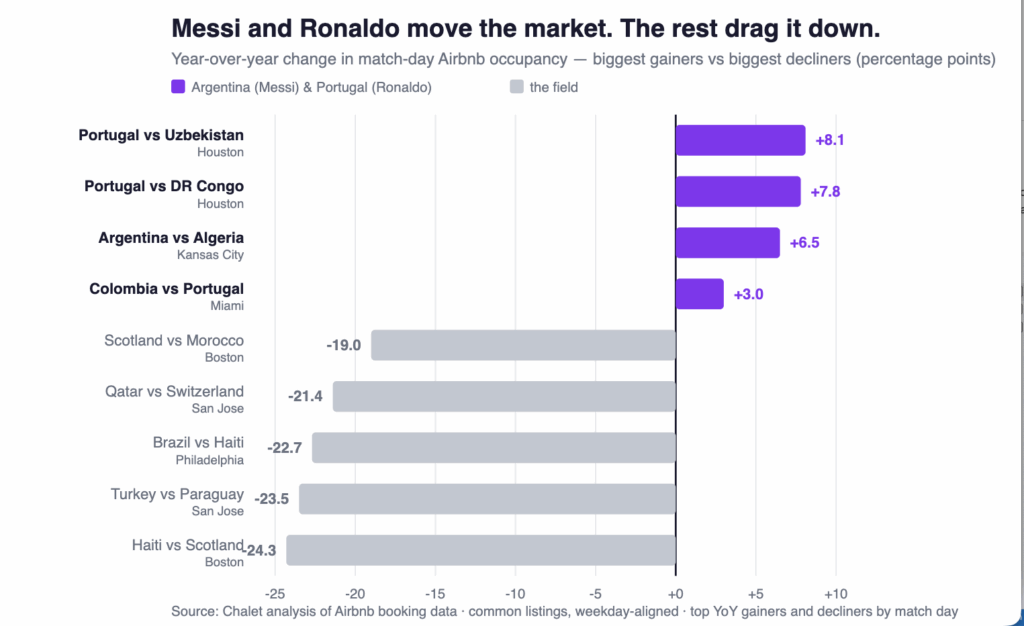
Both legends are confirmed for what is almost certainly their last World Cup. Messi will lead Argentina’s title defense from Group J; Ronaldo’s Portugal headlines Group K. And when you line their fixtures up against the booking data, a pattern jumps out: their teams’ group games are the single biggest occupancy gainers in the entire dataset.
- Ronaldo’s Portugal owns the top of the leaderboard. Portugal vs. Uzbekistan in Houston was up +8.1 percentage points year-over-year — the largest positive swing of any match day measured. Portugal vs. DR Congo, also in Houston, was right behind at +7.8 pp. And Colombia vs. Portugal in Miami lifted occupancy about +5.1 points above a typical June night.
- Messi’s Argentina anchors the one city that’s actually up. Argentina vs. Algeria in Kansas City was up +6.5 pp year-over-year — the third-biggest positive swing in the data. And Kansas City is the only host city where Airbnb demand is up overall (+2.3 pp).
There’s a poetic kicker buried in the schedule. If both teams top their groups and advance, the long-awaited Messi-vs-Ronaldo knockout showdown is slated for Arrowhead Stadium — in Kansas City, the exact city the booking data has flagged as the tournament’s lone bright spot. The market is already behaving as if it knows something.
Hotels are slashing rates, airlines are seeing fewer inbound fans, and Chalet’s booking data shows Airbnb occupancy running below last June in 9 of 10 US host cities. One city — and it isn’t an obvious one — is bucking the slump.
The pitch was always simple. The FIFA World Cup would land in eleven American cities in the summer of 2026, hundreds of thousands of fans would need somewhere to sleep, and the hosts renting out apartments and spare rooms would cash in. Airbnb leaned in, offering new hosts in host cities a $750 bonus and citing a Deloitte estimate that the average host could earn around $3,000 during the tournament. For two years, the windfall has been treated as a foregone conclusion.
The booking data tells a more complicated story. According to short-term-rental data analyzed by Chalet, Airbnb occupancy across the June group-stage window is running below the comparable period a year earlier in 9 of the 10 US host cities we could measure. The mega-event isn’t filling rooms that were empty before. In most of these markets, fewer listings are booked than were booked last June.
And Chalet isn’t measuring this in a vacuum. The hotel industry is flashing the same warning light. In an April survey by the American Hotel and Lodging Association, roughly 80 percent of hotels said their bookings were tracking below initial forecasts. Industry analysts have walked back their projections: lodging-data firm CoStar now expects the tournament to lift US revenue per available room by only about 1.2 percent in June, down from an earlier 1.7 percent projection. As one hospitality analyst put it, if you were counting on the World Cup to bolster your 2026, it’s not going to be a windfall — “it’s just going to be a tiny bit of gravy.”
One city bucks the trend entirely. And it’s not one of the marquee names.
The leaderboard: one winner, nine laggards
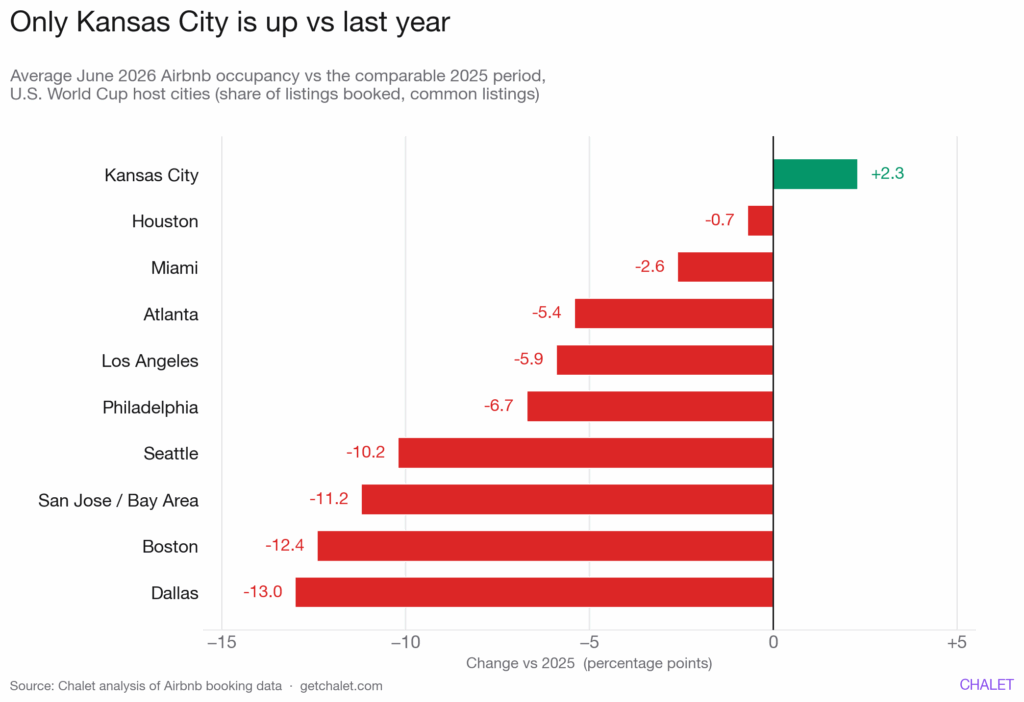
Outside the GOAT glow, the picture is sober. Kansas City is the only host city where Airbnb demand is up — about 36.1% average June occupancy against 33.8% a year earlier, and it beat its 2025 baseline on 18 of 30 days, more than anywhere else.
Everywhere else, the arrow points down:
- Dallas is off the most in absolute terms — about 13 percentage points below last June, though from an unusually high 48.5% base.
- Boston has the largest relative decline: 23.2% against 35.6% a year ago, roughly a 35% drop.
- San Jose / Bay Area is down about 11 points; Seattle about 10.
Four cities — Seattle, San Jose, Boston, and Dallas — failed to beat their 2025 mark on a single June day. For a month meant to be defined by a once-in-a-generation event, that’s a striking flat line.
And Chalet isn’t measuring this in a vacuum. The hotel industry is flashing the same warning light. In an April survey by the American Hotel and Lodging Association, roughly 80 percent of hotels said their bookings were tracking below initial forecasts. Lodging-data firm CoStar has trimmed its projection for the tournament’s lift to US revenue per available room to about 1.2 percent in June, down from an earlier 1.7 percent. As one hospitality analyst put it: if you were banking on the World Cup to bolster 2026, “it’s just going to be a tiny bit of gravy.”
“But isn’t the World Cup supposed to fill rooms?”
Beyond Messi and Ronaldo, there are two fair ways to ask whether match days helped — and they give different answers.
Compared to last year, match days are mostly still underwater. Only Houston — Portugal’s home base for two group games — posted a higher average match-day occupancy than it did in 2025.
Compared to ordinary June days in the same city this year, matches create a small bump in a few places — Houston +1.4 points, Miami +1.0 — but the lift turns negative in most markets, including Dallas (−1.7) and Atlanta (−1.5).
Both readings are true at once: the tournament nudges demand on specific nights — heavily skewed toward marquee teams — but it isn’t enough to lift most markets back above last year. (The two comparisons use different baselines, so their absolute percentages aren’t meant to match.)
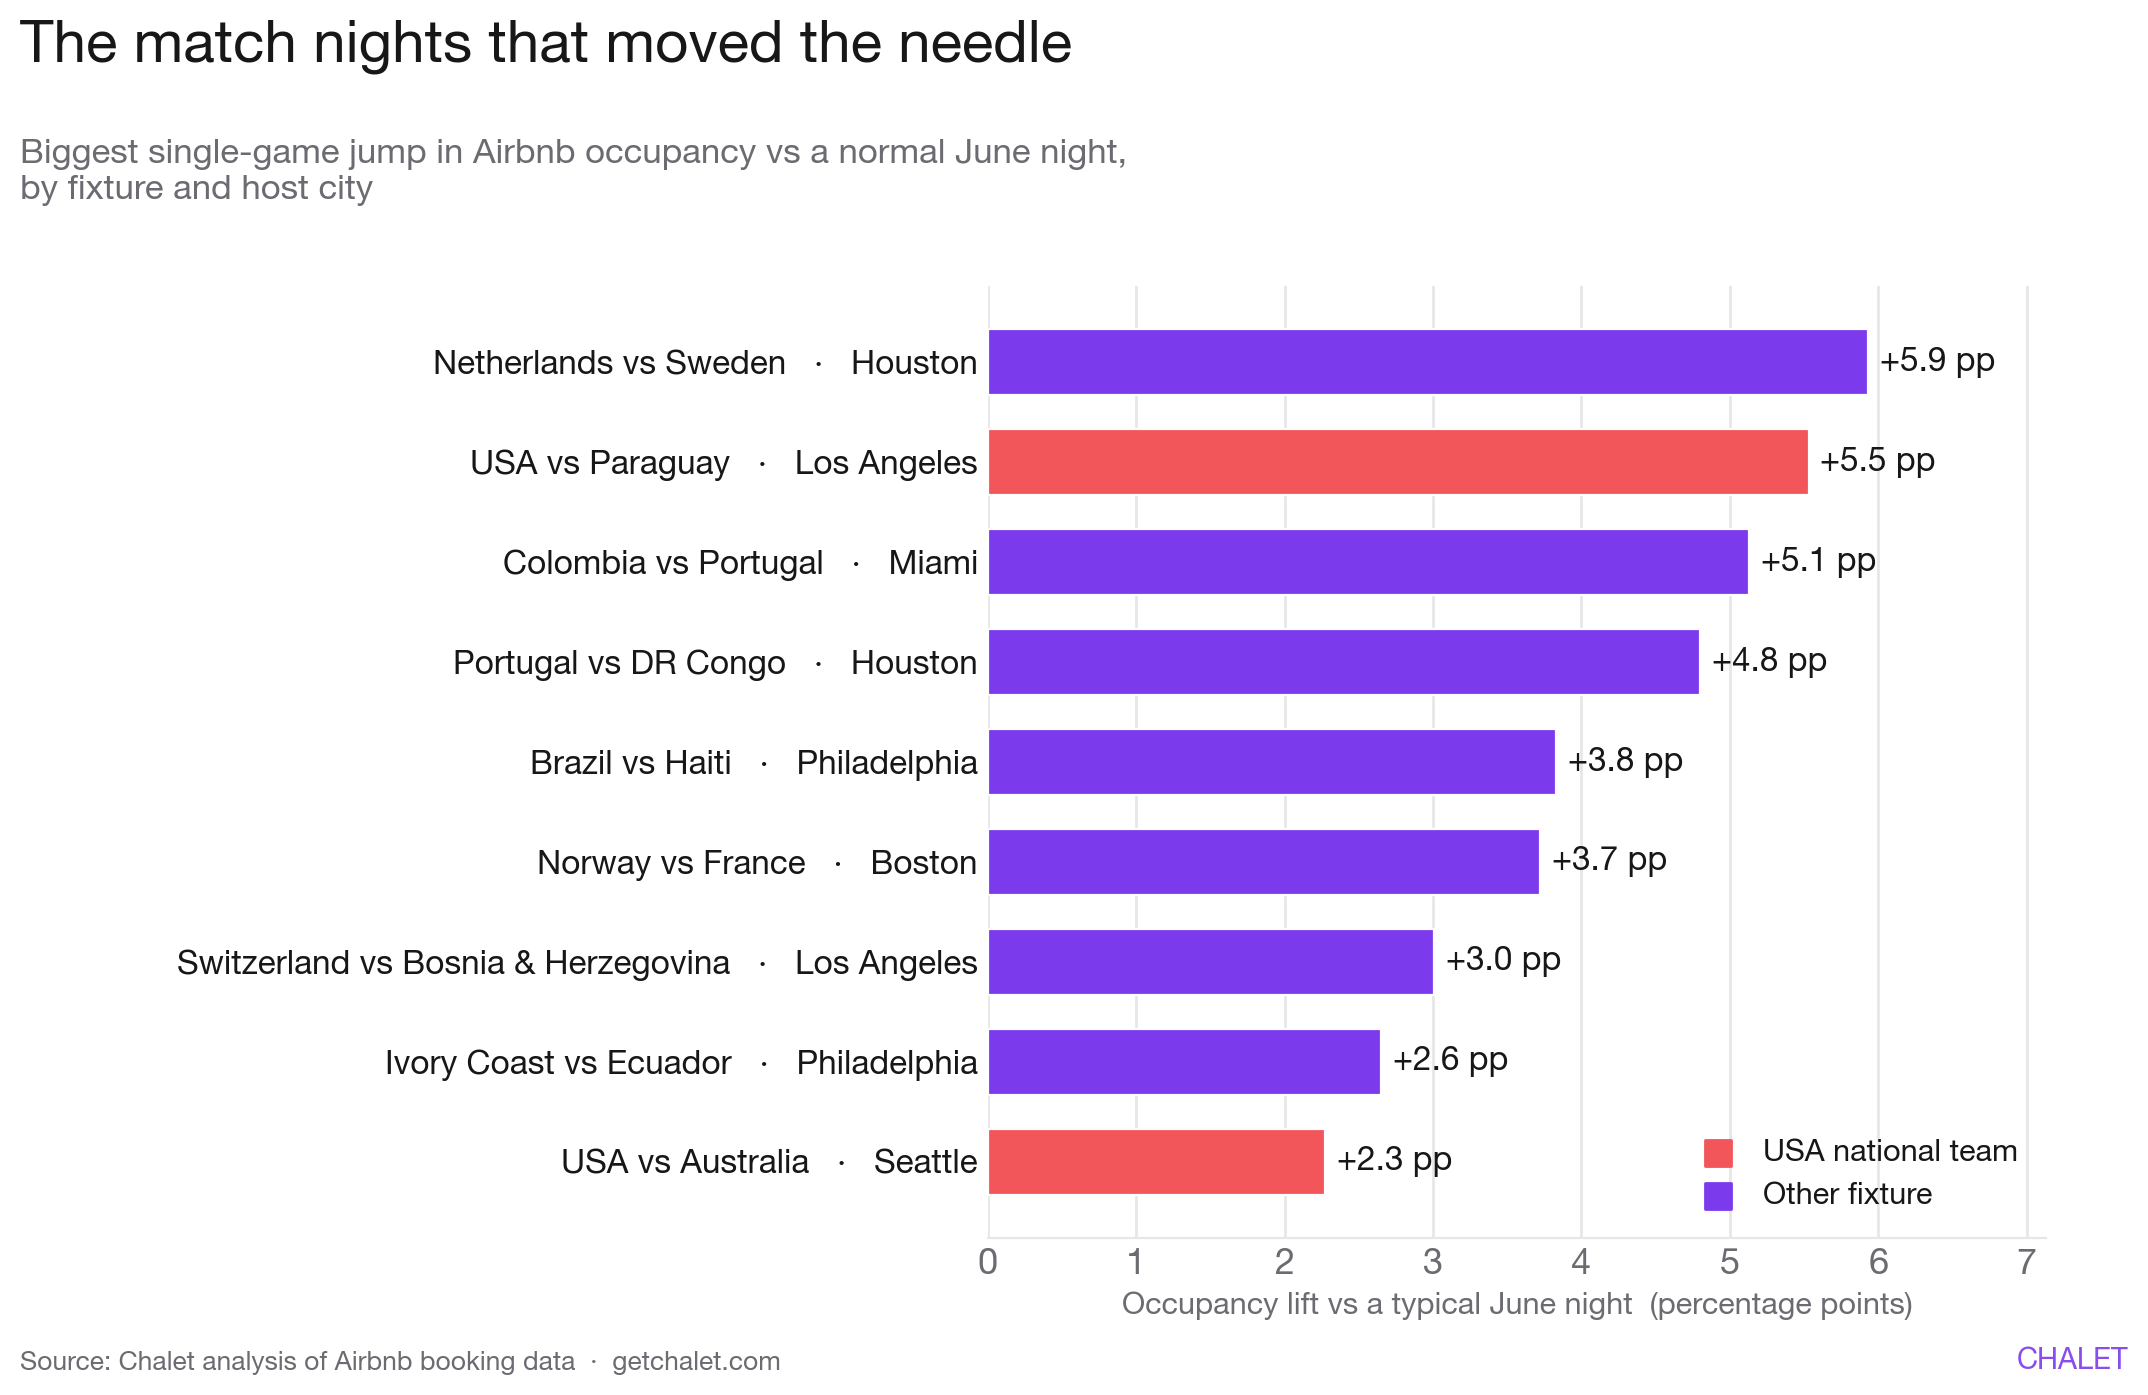
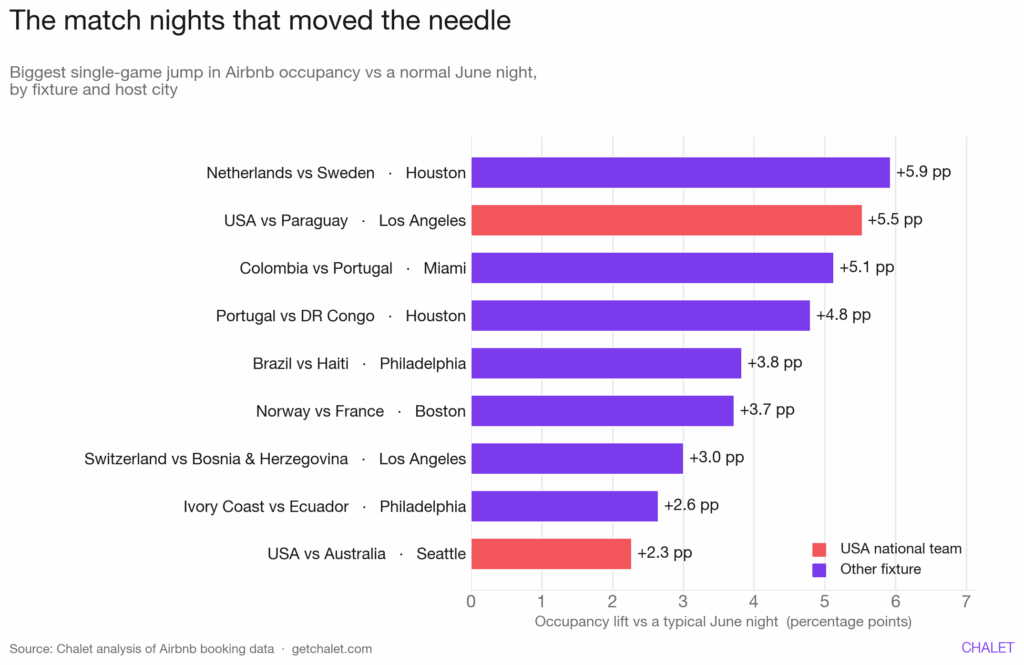
The nights that did pop
Zoom into individual fixtures and the star-power pattern only sharpens.
The single biggest match-night bump belonged to Netherlands vs. Sweden in Houston (June 20) — about 44.9% occupied, ~5.9 points above a typical June night. Then comes the home-team effect: USA vs. Paraguay in Los Angeles (June 12) pushed occupancy to ~47.9%, a 5.5-point lift, and USA vs. Australia in Seattle added 2.3. (Tellingly, the one away USA fixture — Turkey vs. USA in LA — came in 3.4 points below baseline. It’s the home crowd, not just the badge, doing the work.)
But the throughline is star power. Portugal’s two Houston games are the biggest year-over-year gainers anywhere; Argentina’s opener lifted Kansas City; Brazil, Colombia, and the Netherlands all register. The teams people travel for are the teams moving the market.
The flip side: the biggest year-over-year declines cluster in Boston, San Jose, and Philadelphia on specific mid-June dates — drops of 19 to 24 points — largely because those same weekdays were unusually strong in 2025.
The busiest night wasn’t a match at all
If you’re a traveler trying to read this market, the most useful finding has nothing to do with the fixtures.
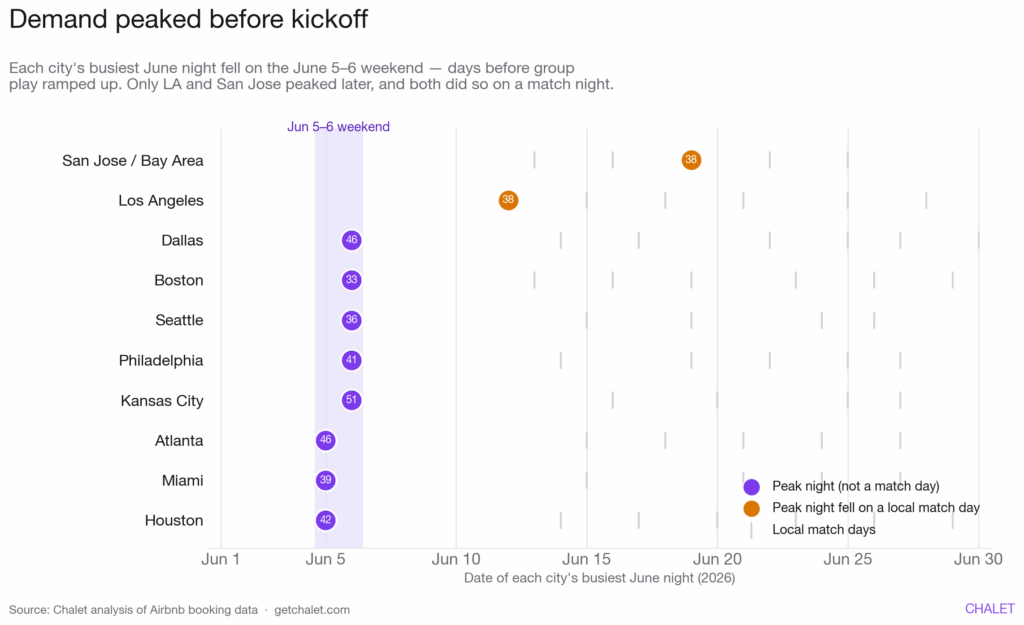
Eight of the ten cities hit their highest occupancy day of the month on the early-June weekend of June 5–6 — before group play even started. Kansas City topped out near 51%, Dallas around 46%, Atlanta near 46% — none of them local match days.
From there, demand softens through the month, with many cities bottoming out around June 30. Kansas City‘s edge over last year was built almost entirely in Week 1 — before its matches began. Meanwhile Boston, Dallas, San Jose, and Seattle dug their deepest holes in the middle two weeks of June — exactly when group matches were most concentrated.
The traveler takeaway: for availability and value, target late-June dates and non-host weekdays. If you’re chasing a marquee night — a Portugal match in Houston, Argentina in Kansas City, or the USA in LA — book early. Those are the evenings that genuinely tighten up.
Why might this be happening?
Chalet’s data shows the what. The wider reporting points to the whys — none conclusions on their own.
First, 2025 was already strong. Several cities are measured against high prior-year baselines — Dallas at 48.5%, San Jose at 42% — and beating a high number is hard.
Second, international demand has cooled. Airline-data firm Cirium found June 2026 bookings from Europe to US host cities down about 5 percent and from Asia down 3.6 percent — notable given FIFA has advised host cities to expect a roughly 50/50 domestic-international split. Reporting ties the softness to visa barriers, weaker international travel appetite, and high ticket prices; in Arlington, Texas — host to the most matches — a tourism official acknowledged slower-than-expected hotel demand and pointed to anti-US sentiment as a factor.
Third, supply is flooding in. Airbnb has rolled out its largest-ever new-host incentive — $750 for first-time entire-home hosts who welcome their first guests in a host city before the end of July 2026 — an explicit push to expand inventory ahead of the tournament. When a wave of new listings hits a market at once, the same pool of demand gets spread across more rooms, and the share of listings booked on any given night can fall even if the raw number of bookings holds steady or rises. A more crowded market is a harder market for any single host to fill — and it would show up precisely as softer occupancy. (Crucially, this is not what’s dragging Chalet’s headline numbers down — the methodology below explains why — but it’s a real force shaping the broader market fans are booking into.)
Fourth, price may be doing the displacing. Many host-city hotels held rates high awaiting a surge that hasn’t fully landed, with discounting expected closer to kickoff. On tickets, resale prices for some matches fell sharply — one group-stage game dropped below $100 with thousands still unsold. As the all-in cost of attending rises, some fans wait, some travel shorter distances, and some don’t book — which is exactly where Chalet sees the softness.
A gentler caveat: these bookings are forward-looking — nights reserved as of a recent snapshot, not final stays. Closer-in dates fill late, so some late-June softness reflects reservations that simply haven’t happened yet, and the gap could narrow as the matches near. And to be clear about the one thing this data is not measuring: Chalet’s year-over-year figures compare the same individual listings in both years — only properties that were active in June 2025 and June 2026 are counted. New listings spun up for the tournament are excluded from the comparison entirely. So the declines above are not an artifact of new supply flooding in; they reflect the same homes drawing fewer booked nights than they did a year ago. Rising supply is reshaping the broader market, but it cannot explain Chalet’s headline drop.
A note on what these numbers are
To keep this honest: the figures above measure occupancy — the share of a city’s Airbnb listings with at least one booked night on a given day. They say nothing about nightly prices or how much hosts earn. A market can be less full and more lucrative per booking, or vice versa; this data can’t tell you which.
Year-over-year comparisons are same-listing and weekday-aligned: each property is compared only against itself a year earlier (June 2026 vs. the same weekday in June 2025), and only listings active in both years are included. That means the change reflects real shifts in demand for the same homes — not calendar quirks, and not new inventory entering the market. New York/New Jersey, which hosted matches at MetLife Stadium, is not in this dataset and is excluded throughout.
The kicker
Strip it down and the 2026 World Cup, as told by Airbnb bookings, is a tale of two tournaments. There’s the one with Messi and Ronaldo in it — where their final-act group games light up Houston, Miami, and Kansas City, and where the data is already pointing at the city that could host their last dance. And there’s everything else — nine of ten markets quietly running below last summer, with the hotel industry nodding along.
For travelers, that’s quietly good news: the smart money books the off-nights and lets the GOAT cities run hot. For hosts banking on the World Cup to fill a calendar by itself, the data is a gentle caution — the crowd is coming, but unless Messi or Ronaldo is in town, it isn’t booking the way everyone assumed it would.

