Introduction
Oceanside, California, known for its stunning coastline and vibrant atmosphere, has become a hotspot for both tourists and real estate investors alike.
The city’s short-term rental market has been experiencing significant growth and transformation in recent years. In this blog post, we will delve into the key statistics and trends that define the Airbnb rental market in Oceanside, CA.
We will also explore various aspects of the city, including its economic profile, climate, demographics, and popular attractions.

Market Overview
To understand the dynamics of the short-term rental market in Oceanside, let’s delve into some key statistics and figures.
Supply
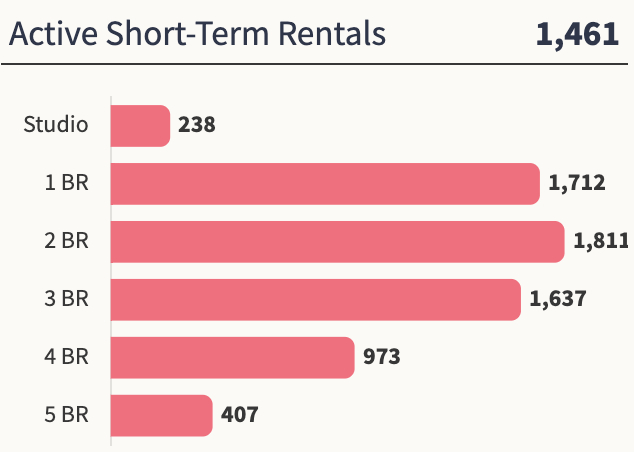
AS of July 2025, the most popular homes are 2-bedroom homes, comprising 26.36% of inventory. This is followed by 1 and 3-bedroom homes at 20.60% and 20.32% of the total inventory, respectively.
Homes Appreciation
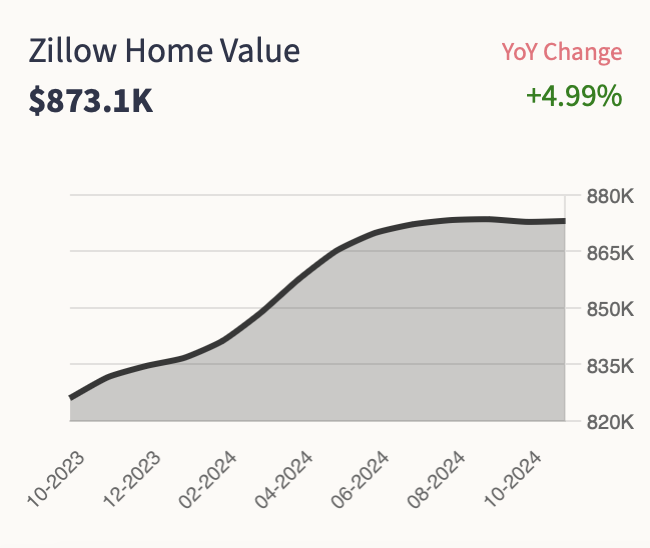
AS of July 2025, according to Zillow, homes in Oceanside experienced an appreciation of 4.99%. This data indicates a significant increase in property values.
Median Home Value
As of January of 2025, Homes in Oceanside have appreciated by 4.99%. The median home value in Oceanside is $873,100 as reported by Zillow. This figure highlights the city’s robust real estate market and the potential for long-term property appreciation.
Active Short Term Rentals
AS of July 2025, Oceanside boasts a significant Airbnb rental market, with approximately 974 active rentals. This abundance of available properties provides ample opportunities for investors and homeowners looking to capitalize on the tourism demand.
Average Daily Rate
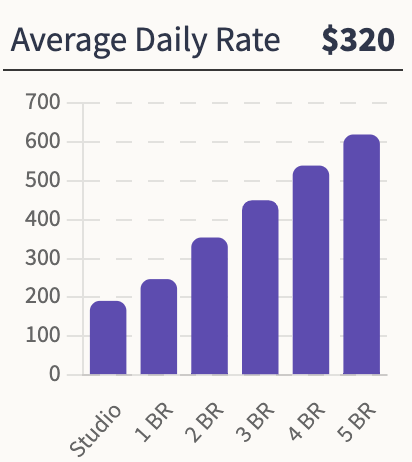
The median ADR for the market is $320. The Average Daily Rate is the highest for 5-bedroom homes $619, followed by 4-bedrooms and 3 bedrooms at $539 and $450 respectively.
Occupancy Rate
Chalet data reveals an occupancy rate of 61% for Airbnb rentals in Oceanside. This high demand ensures a consistent stream of income for property owners and investors.
How Profitable is Airbnb in Oceanside ?
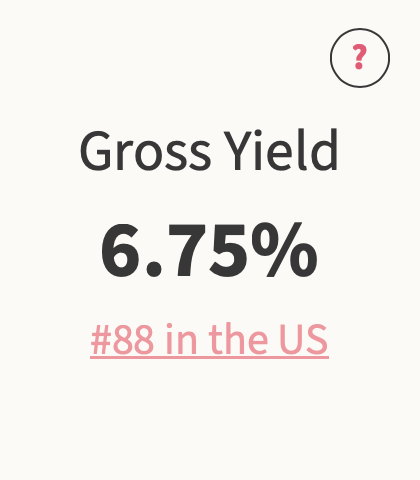
AS of July 2025, the average gross yield, which represents the annual income generated by a property as a percentage of its value, is 6.75% in Oceanside. This figure suggests that short-term rentals in the city offer a favorable return on investment. Oceanside is ranked #86 by return on investment on Airbnb rentals in the United States.
Annual Revenue
According to Chalet, short-term rentals in Oceanside earn an average of $61,170 annually, highlighting the strong investment potential in the city’s market. You can evaluate your properties using our free Airbnb calculator.
Hosts
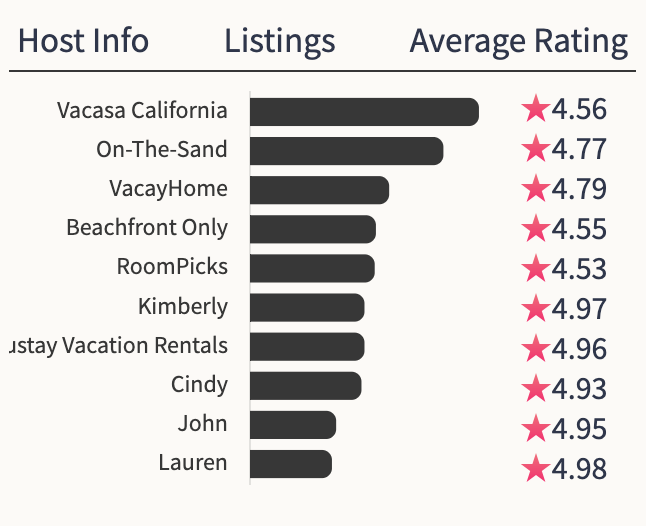
The market is dominated by property management firms. The largest host is Vacasa California with 4.56% of the total inventory and an average review of 4.77⭐️s .
Property Tax
According to SmartAsset, the average property tax in Oceanside is 0.75%. This relatively moderate tax rate is an important consideration for those looking to invest in short-term rental properties.
Guests
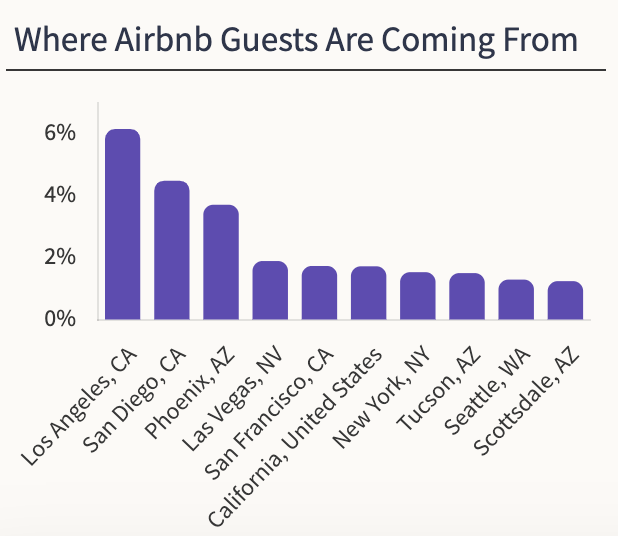
The majority of the guests in Oceanside come from California and are within driving distance. 6.16% of all guests are from Los Angeles followed by San Diego with 4.49%.
Regulations
Oceanside’s short-term rental regulations are somewhat investor-friendly, with different zoning regulations and limitations in place. Understanding these regulations is crucial for potential investors to ensure compliance and a smooth operation.


