
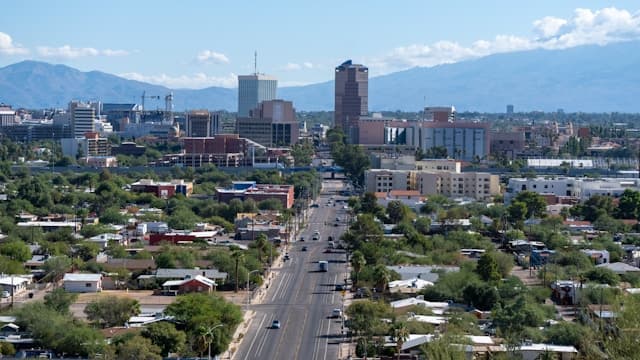
According to Chalet Data, Tucson’s short-term rental market is a study in contrasts. Gross yields among the city’s best neighborhoods range from 8.8% down to 5.5%, clustering mostly in central and western pockets where home values are moderate and guest demand is driven by seasonality. Entry prices vary widely, from $256,000 in Garden District to $555,000 in Sam Hughes, but even the priciest areas compete on annual revenue thanks to strong winter and spring peaks.
Tucson’s overall gross yield sits at the US median (9.0%), but the past year has brought a sharp occupancy drop, down 22% citywide, while ADR climbed 31%, signaling a market where pricing power is up but competition for bookings is real. Investors need to weigh not just yield but also the seasonal rhythm.
Winter still delivers 31% of annual revenue, and occupancy can swing from 75% in February to 30% in June. If you’re aiming to buy in Tucson, understanding these local patterns is essential.
Tucson Short-Term Rental Market at a Glance
- Median gross yield: 9.0%
- Annual revenue (headline): $29,401
- Active-operator revenue: $28,662
- Median occupancy rate: 47%
- Average daily rate (ADR): $158
- Median home value (ZHVI): $326,242 (YoY -3.0%)
- Active full-time listings: 3,252
- US gross-yield rank: #232
- Data period: 2025-07 to 2026-06
The Best Tucson Neighborhoods for Airbnb, Ranked by Yield
| Rank | Neighborhood | Gross Yield | Annual Revenue | Median Home Value | ADR | Occupancy | Active Listings |
|---|---|---|---|---|---|---|---|
| 1 | Starr Pass | 8.8% | $29,962 | $340,438 | $135 | 32% | 115 |
| 2 | Palo Verde | 8.0% | $24,220 | $301,237 | $122 | 55% | 48 |
| 3 | Garden District | 7.9% | $20,247 | $256,185 | $138 | 37% | 33 |
| 4 | Menlo Park | 7.8% | $28,435 | $363,389 | $162 | 40% | 36 |
| 5 | Peter Howell | 7.0% | $25,848 | $369,665 | $135 | 52% | 33 |
| 6 | Sam Hughes | 6.8% | $37,827 | $555,724 | $167 | 42% | 74 |
| 7 | Rincon Heights | 6.8% | $22,284 | $329,933 | $129 | 53% | 32 |
| 8 | Blenman Elm | 6.5% | $28,076 | $434,435 | $132 | 50% | 61 |
| 9 | Feldman S | 5.5% | $19,132 | $348,051 | $106 | 55% | 43 |
| 10 | Armory Park | 5.5% | $25,089 | $460,324 | $150 | 50% | 49 |
Source note: Data as of July 11, 2026. Annual revenue is calculated for each neighborhood as median ADR × median occupancy × 365, using trailing 12-month data, and represents gross income before expenses. The table reports the median listing’s revenue, ADR, and occupancy, each calculated independently.
Multiplying table ADR by occupancy will not reproduce the revenue figure. Gross yield divides median annual revenue by median home value (Zillow ZHVI). See full methodology. The active-operator revenue figure filters to listings with sustained booking activity, a more realistic underwriting benchmark for buyers than the all-listings average.
1. Starr Pass: Resort Area with the Highest Yield
Starr Pass leads Tucson’s short-term rental market with an 8.8% gross yield, just shy of the citywide median. This neighborhood is defined by its resort setting, with golf courses and desert trails attracting both leisure travelers and snowbirds. Home values here have dipped 5.9% year over year, landing at $340,438, which keeps entry costs moderate for a resort-adjacent area.
Seasonality is pronounced. Occupancy surges to 80% in March, then drops to zero in May, with winter and fall each contributing nearly a quarter of annual revenue.
The median daily rate is $135, well below the US median, but the area’s unique demand drivers, proximity to the JW Marriott and trailheads, help listings achieve $29,962 in annual revenue. Notably, occupancy has fallen sharply (down 84% year over year), and ADR is down 10%, signaling a market where owners must compete for bookings.
Active operators earn $29,252, and the typical payback period is about 11.6 years. The most common listing is a one-bedroom, but two-bedrooms earn the most. For a deeper dive into the numbers, see the Starr Pass analytics page.
| Gross yield | 8.8% |
| Annual revenue | $29,962 |
| Active-operator revenue | $29,252 |
| Occupancy | 32% |
| ADR | $135 |
| Median home value (YoY) | $340,438 (-5.9%) |
| Full-time listings | 115 |
Who this market is ideal for: Buyers seeking a resort-style setting with strong winter demand and moderate entry prices.
2. Palo Verde: High Occupancy and Affordable Entry
Price-conscious buyers will find Palo Verde offers a compelling blend of affordability and booking stability, with a median home value of $301,237 and a 55% occupancy rate.
This neighborhood’s occupancy outpaces the US median of 45%, even though its gross yield of 8.0% sits below the national midpoint, ranking at the 39th percentile among 501 US markets. The typical property is a two-bedroom, providing an approachable entry point for those new to short-term rental investing while yielding $18,886 per year at a $130 ADR.
Strong winter demand shapes Palo Verde’s performance, with January occupancy peaking at 75% and winter capturing 31% of annual revenue. In contrast, occupancy drops to just 38% in September, showing pronounced seasonality. Over the past year, ADR surged 36% even as occupancy fell 15%, indicating that operators have successfully raised nightly rates while facing softer demand.
With a payback period of about 12.5 years based on gross active-operator revenue, investors can underwrite for moderate risk and reliable returns, especially given the neighborhood’s 48 full-time listings that reflect a stable, established market. The Palo Verde analytics page breaks down the full bedroom mix and seasonality curves.
| Gross yield | 8.0% |
| Annual revenue | $24,220 |
| Active-operator revenue | $24,074 |
| Occupancy | 55% |
| ADR | $122 |
| Median home value (YoY) | $301,237 (-1.7%) |
| Full-time listings | 48 |
Who this market is ideal for: Investors prioritizing steady bookings and lower price points over peak ADR.
3. Garden District: Budget-Friendly with Spring Peaks
Spring surges define Garden District’s rental calendar, with occupancy cresting at 71% each March and spring alone generating 29% of annual revenue. September, by contrast, sees occupancy plunge to just 16%, highlighting the pronounced seasonality that owners must navigate. The area’s $138 average daily rate is well below the US median, but a dramatic 44% year-over-year ADR jump shows that even budget-friendly homes can attract robust nightly rates during Tucson’s busiest months.
Against the national field, Garden District’s 7.9% gross yield ranks in the 38th percentile, trailing the US median of 9.0%, while its 37% occupancy also sits below the national norm. The payback period of 12.8 years, calculated from active-operator revenue, signals that investors should expect a longer horizon to recoup their purchase price compared to faster-moving markets.
With 33 full-time listings and a typical two-bedroom mix, underwriting here means planning for both the low entry cost and the sharp swings in demand that shape returns. For more on revenue and booking trends, the Garden District analytics offer granular detail.
| Gross yield | 7.9% |
| Annual revenue | $20,247 |
| Active-operator revenue | $20,034 |
| Occupancy | 37% |
| ADR | $138 |
| Median home value (YoY) | $256,185 (-2.0%) |
| Full-time listings | 33 |
Who this market is ideal for: Buyers seeking low entry costs and strong spring demand, willing to manage off-season volatility.
4. Menlo Park: Historic Character and Strong Winter Revenue
Winter’s dominance in Menlo Park is clear, with 34% of annual revenue arriving in the season and February occupancy spiking to 75% at an ADR of $207. Yet, the market’s overall occupancy has dropped 29% year-over-year, now sitting at 40%, notably below the US median of 45%.
Despite this softness, ADR jumped 69% over the same period, indicating that the area’s blend of historic architecture and proximity to the Mercado district allows operators to command premium rates even as demand cools in off-peak months like September, when occupancy sinks to just 17%.
With a gross yield of 7.8%, Menlo Park falls in the 37th percentile nationally, trailing the US median of 9.0% but offering above-average annual revenue of $28,435. The payback period stands at roughly 13.1 years, a figure shaped by both solid winter pricing and a relatively accessible median home value of $363,389.
The 36 active full-time listings suggest a moderate level of competition, and the ability for active operators to earn $27,802 annually underscores the importance of capturing peak-season demand. Menlo Park’s numbers reflect a market where historic charm and strategic pricing during high season help offset softer periods, making it a fit for investors who can navigate pronounced seasonality. For more details, see the Menlo Park analytics.
| Gross yield | 7.8% |
| Annual revenue | $28,435 |
| Active-operator revenue | $27,802 |
| Occupancy | 40% |
| ADR | $162 |
| Median home value (YoY) | $363,389 (-3.2%) |
| Full-time listings | 36 |
Who this market is ideal for: Investors drawn to historic neighborhoods with strong winter peaks and resilient ADR.
5. Peter Howell: High Occupancy with a Supply Squeeze
Winter’s dominance is clear in Peter Howell, with February occupancy soaring to 80% and the average daily rate reaching $161. By contrast, September occupancy drops to 44%, underscoring the neighborhood’s pronounced seasonal swings. Over the latest 12 months, winter and spring together generated 62% of annual revenue, helping to offset the slower summer and fall periods. This pronounced winter-spring skew shapes both pricing and guest expectations, making timing critical for maximizing returns.
Operators in Peter Howell have seen a remarkable shift. Occupancy surged 14% year-over-year, while ADR jumped 68% and active listings fell 21%. This supply squeeze means fewer properties are capturing more demand at higher prices, driving annual revenue for active operators to $25,184, nearly matching the headline figure.
The payback period stands at 14.7 years, reflecting a market where strong occupancy helps offset home values that remain above Tucson’s entry tier, though the 7.0% gross yield places Peter Howell in the 29th percentile nationally, below the US median of 9.0%. The Peter Howell analytics show how these dynamics reward investors who can navigate the neighborhood’s evolving supply-demand balance.
| Gross yield | 7.0% |
| Annual revenue | $25,848 |
| Active-operator revenue | $25,184 |
| Occupancy | 52% |
| ADR | $135 |
| Median home value (YoY) | $369,665 (-2.8%) |
| Full-time listings | 33 |
Who this market is ideal for: Buyers seeking high occupancy and a market where supply is tightening.
6. Sam Hughes: Premium Properties, Premium Revenue
Home values in Sam Hughes are the highest among Tucson’s top STR markets, with a median of $555,724, and the area’s annual revenue leads the list at $37,827. Winter is especially lucrative here, as February occupancy soars to 78% with a $194 ADR, while September sees a sharp drop to just 17% occupancy, highlighting the neighborhood’s strong seasonality.
Compared to the US field, Sam Hughes’s 6.8% gross yield places it in the 26th percentile, trailing the national median of 9.0%, and occupancy rates also fall slightly below the US median.
Recent data shows a supply squeeze, with listings down 18% year over year, fueling a 14% jump in occupancy and a 20% rise in ADR for June 2026. This tightening market means premium properties are capturing more bookings and commanding higher prices, especially during peak months.
The payback period sits at about 14.8 years of gross active-operator revenue, reflecting a higher entry cost but also stable, above-average earnings for well-positioned listings. Investors will note that while one-bedrooms are most common, three-bedroom properties generate the highest annual revenue, indicating that larger homes can outperform in this premium segment. The Sam Hughes analytics break down revenue by bedroom count and season.
| Gross yield | 6.8% |
| Annual revenue | $37,827 |
| Active-operator revenue | $37,605 |
| Occupancy | 42% |
| ADR | $167 |
| Median home value (YoY) | $555,724 (-1.8%) |
| Full-time listings | 74 |
Who this market is ideal for: Investors targeting higher-end properties with strong revenue potential and a stable guest base.
7. Rincon Heights: Steady Bookings with Summer Peaks
Summer demand shapes Rincon Heights’ rental calendar, with occupancy surging to 66% in August at a lower-than-average ADR of $94. Winter and spring together account for 58% of annual revenue, but summer’s 25% share signals a reliable secondary peak, likely due to university-related travel and seasonal visitors. May’s occupancy low of 32% highlights the off-season dip, but the area’s proximity to campus supports a baseline of steady bookings year-round.
Recent data show occupancy rates declining 39% year-over-year even as the average daily rate jumped 57%, a sign that hosts are adjusting pricing to offset softer demand. Rincon Heights’ gross yield of 6.8% sits at the 25th percentile nationally, below the US median of 9.0%, while its 53% occupancy rate comfortably beats the US median of 45%.
With only 32 active full-time listings and a payback period near 14.9 years, underwriting here requires careful attention to shifting demand and the ability to capture higher nightly rates during peak periods. The Rincon Heights analytics detail the seasonal and bedroom mix trends that shape returns here.
| Gross yield | 6.8% |
| Annual revenue | $22,284 |
| Active-operator revenue | $22,153 |
| Occupancy | 53% |
| ADR | $129 |
| Median home value (YoY) | $329,933 (-2.0%) |
| Full-time listings | 32 |
Who this market is ideal for: Buyers looking for steady bookings near the university and a market with strong summer demand.
8. Blenman Elm: Classic Homes, Consistent Performance
Revenue trends in Blenman Elm reflect a dependable seasonal pattern, with winter commanding 34% of annual revenue and February occupancy soaring to 83% at a $171 nightly rate. By contrast, June marks the slowest period at just 28% occupancy, but even then, ADR holds at $132, helping to buffer summer’s revenue dip. This reliable winter surge is driven by snowbird demand and proximity to the University of Arizona, while the summer slowdown mirrors Tucson’s broader travel lull as temperatures climb.
With a 6.5% gross yield, Blenman Elm ranks in the 21st percentile nationally, trailing the US median of 9.0%. However, occupancy outpaces the US median by five points, and the area’s $434,435 median home value is supported by a steady flow of 61 full-time listings. Investors should note the roughly 15.9-year payback period, which reflects both the neighborhood’s classic housing stock and moderate price appreciation.
The prevalence of one-bedroom properties (over half of full-time listings) signals a market well-suited to solo travelers and couples, helping to maintain occupancy and limit volatility even as overall listings declined 9% year-over-year. The Blenman Elm analytics provide further detail on property types and revenue distribution.
| Gross yield | 6.5% |
| Annual revenue | $28,076 |
| Active-operator revenue | $27,280 |
| Occupancy | 50% |
| ADR | $132 |
| Median home value (YoY) | $434,435 (-1.4%) |
| Full-time listings | 61 |
Who this market is ideal for: Investors seeking classic homes and a market with stable occupancy and ADR trends.
9. Feldman S: Entry-Level Pricing and Steady Bookings
Affordability shapes Feldman S, where a median home value of $348,051 and a 5.5% gross yield put it in the 13th percentile among 501 US markets. While the yield trails the US median of 9.0%, occupancy climbs to 55%, outpacing the national median by 10 points and signaling that demand remains healthy for budget-friendly options.
February is the market’s strongest month, with occupancy peaking at 76% and ADR reaching $155, while May marks the slowest period with occupancy dropping to 33% as seasonal travel wanes.
Operators here face an ~18.8-year payback period, reflecting the moderate revenue potential relative to purchase price, but steady bookings and a 53% surge in ADR over the past year help offset a 5% dip in occupancy.
The dominance of one-bedroom listings (24 out of 43, earning $10,827 per year) suggests investors typically target solo travelers or couples, which aligns with the area’s consistent but modest revenue. A 7% decline in active listings has helped maintain occupancy, even with shifting demand patterns. The Feldman S analytics show how entry-level pricing and consistent bookings can yield steady, if modest, returns.
| Gross yield | 5.5% |
| Annual revenue | $19,132 |
| Active-operator revenue | $18,496 |
| Occupancy | 55% |
| ADR | $106 |
| Median home value (YoY) | $348,051 (+0.2%) |
| Full-time listings | 43 |
Who this market is ideal for: Buyers seeking affordable entry and reliable bookings, even if yield is below city averages.
10. Armory Park: Historic Downtown with Strong Peaks
Winter demand creates dramatic swings in Armory Park, with February occupancy soaring to 80% and the average daily rate peaking at $190 before plunging to just 20% occupancy in June. This pronounced seasonality drives a winter-heavy revenue mix (30% of annual earnings), while summer’s contribution shrinks to 21%.
The area stands out for its occupancy rate, which at 50% edges above the US median of 45%, even though its 5.5% gross yield ranks at only the 13th percentile among 501 US markets.
Recent momentum data reveal that although average daily rates climbed 21% year over year, occupancy dropped sharply by 40% and the number of listings contracted by 12%. Most listings are one-bedrooms (33 out of 49), earning $19,405 annually, which signals a guest profile skewed toward solo travelers and couples rather than families or large groups.
With a payback period of about 18.6 years at current prices, investors face a longer timeline to recoup their investment, likely reflecting high home values and a softening demand environment. The Armory Park analytics provide a closer look at how historic character and downtown proximity shape demand.
| Gross yield | 5.5% |
| Annual revenue | $25,089 |
| Active-operator revenue | $24,751 |
| Occupancy | 50% |
| ADR | $150 |
| Median home value (YoY) | $460,324 (-1.4%) |
| Full-time listings | 49 |
Who this market is ideal for: Investors looking for historic downtown properties with strong winter peaks and a diverse guest base.
How to read these rankings before you buy
Gross yield is a quick way to compare potential returns across neighborhoods, but it doesn’t capture every risk or expense. The headline annual revenue reflects all listings, while the active-operator figure filters for properties with sustained bookings, a more realistic benchmark for buyers.
Multiplying ADR by occupancy gives a rough sense of monthly income, but property-level performance can diverge based on amenities, reviews, and management quality. These rankings highlight where the numbers look strongest at the median, but due diligence on individual properties is essential. Always confirm local rules and operating costs before making an offer.
How to Act on This
Buying a short-term rental in Tucson means navigating a market shaped by seasonality, fluctuating occupancy, and a wide range of home values. Winter and spring are the strongest seasons, so properties that stand out in those months can outperform. Look for homes near demand drivers, resorts, the university, downtown, or trailheads, and be ready to adjust pricing during slower summer months. Regulation is relatively favorable.
Arizona law preempts most city-level bans, but you must obtain a Transaction Privilege Tax (TPT) license and comply with local health, safety, and nuisance ordinances. The city’s 10% transient occupancy tax applies to short-term rentals. Always verify current requirements, as enforcement and local rules can evolve. For a tailored search and up-to-date guidance, connect with a Tucson short-term rental agent who knows the market’s nuances and regulatory landscape.