
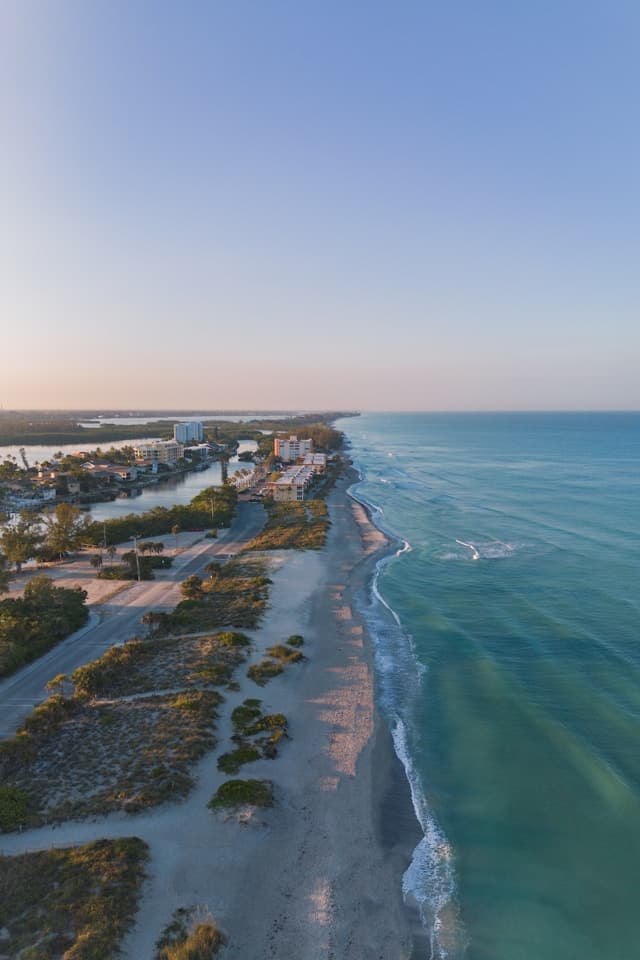
According to Chalet Data, Sarasota’s short-term rental market stands out for its wide yield spread and dynamic seasonality. Gross yields across the city’s top neighborhoods range from 8.4% to a remarkable 19.2%, with entry prices spanning $302,100 to $569,317. Sarasota’s median yield lands at 12.2%, placing it in the 77th percentile of all U.S. markets. This performance is anchored in the city’s blend of Gulf Coast beaches, cultural draws, and a steady stream of seasonal visitors.
While home values have dipped nearly 9% year-over-year, demand remains robust in core neighborhoods, and occupancy is still above the national median. The past year saw occupancy soften by 8% but ADRs surge 26%, signaling resilient pricing power even as active listings fell.
The neighborhoods that top this list cluster east and south of downtown, where lower price points and strong spring peaks drive returns. For buyers, Sarasota offers both high-yield opportunities and a diverse set of property types.
Sarasota Short-Term Rental Market at a Glance
- Median gross yield: 12.2%
- Median annual revenue: $50,400
- Active-operator annual revenue: $49,100
- Median occupancy: 48%
- Median ADR: $302
- Median home value (ZHVI): $413,040 (down 8.8% YoY)
- Active full-time listings: 3,565
- US gross yield rank: #109 of 501
- Data period: July 2025 – June 2026
The Best Sarasota Neighborhoods for Airbnb, Ranked by Yield
| Rank | Neighborhood | Gross Yield | Annual Revenue | Median Home Value | ADR | Occupancy | Active Listings |
|---|---|---|---|---|---|---|---|
| 1 | Sarasota Springs | 19.2% | $64,700 | $337,600 | $249 | 54% | 111 |
| 2 | Arlington Park | 15.8% | $78,200 | $493,500 | $314 | 52% | 63 |
| 3 | Gulf Gate Estates | 12.4% | $39,700 | $319,300 | $234 | 45% | 206 |
| 4 | Alta Vista | 12.0% | $45,300 | $378,500 | $234 | 55% | 35 |
| 5 | Indian Beach Sapphire Shores | 11.7% | $66,900 | $569,300 | $204 | 55% | 67 |
| 6 | Vamo | 10.7% | $32,200 | $302,100 | $222 | 29% | 36 |
| 7 | Ridge Wood Heights | 10.3% | $35,200 | $342,200 | $244 | 43% | 73 |
| 8 | Whitfield | 9.7% | $41,900 | $433,900 | $217 | 47% | 72 |
| 9 | Southgate | 9.6% | $43,000 | $446,800 | $237 | 33% | 111 |
| 10 | South Gate Ridge | 8.4% | $28,900 | $344,500 | $211 | 52% | 46 |
Data as of July 11, 2026. Each listing’s annual revenue is calculated from its own ADR × occupancy × 365, using trailing 12-month data, and is gross before expenses. The table reports the median listing’s revenue, alongside median ADR and median occupancy, which are computed independently, multiplying the table’s ADR by occupancy will not reproduce the revenue figure.
Gross yield divides the median revenue by the median home value (Zillow ZHVI). See methodology for details. The active-operator revenue benchmark filters to listings with sustained booking activity and is what a committed buyer should underwrite against.
1. Sarasota Springs: Top yield, spring surge, and affordable entry
Price-conscious investors will notice Sarasota Springs’ combination of affordability and performance, as the median home value of $337,614 (down 7.9% year-over-year) enables a much lower entry cost than many comparable US markets.
The area’s 19.2% gross yield sits in the 96th percentile nationally, far outpacing the 9.0% US median and reflecting a market where both occupancy and nightly rates are well above average. March brings a dramatic surge, with occupancy peaking at 80% and ADR reaching $260, while even the October trough maintains a 32% occupancy, underscoring the neighborhood’s resilience across seasons.
Recent data shows a pronounced supply squeeze. Listings fell 23% year-over-year, tightening availability just as demand pushed ADR up by 29% and occupancy by 8%. This dynamic supports robust active-operator revenue at $61,930 and a swift 5.5-year payback period, one of the shortest in Sarasota.
The dominance of 3-bedroom homes (72 listings) caters to families and groups, broadening appeal and helping owners capture both peak spring demand (28% of annual revenue) and steady winter bookings (27%). Sarasota Springs’ mix of accessible inventory, seasonal momentum, and strong fundamentals makes it a standout for buyers focused on high returns and rapid recoupment of investment.
For a closer look at seasonality and bedroom mix, see the Sarasota Springs analytics page.
| Gross yield | 19.2% |
| Annual revenue | $64,700 |
| Active-operator revenue | $61,930 |
| Occupancy | 54% |
| ADR | $249 |
| Median home value (YoY) | $337,614 (-7.9%) |
| Full-time listings | 111 |
Who this market is ideal for: Buyers seeking high cash-on-cash returns and a short payback window in a family-friendly, accessible location.
2. Arlington Park: High revenue, resilient occupancy, and premium homes
Revenue performance in Arlington Park is among the nation’s best, with a 15.8% median gross yield placing it in the 91st percentile of 501 US markets. The neighborhood draws steady demand during peak months, as March occupancy surges to 76% with daily rates averaging $391, while the September low of 38% reflects Sarasota’s off-season. Central location and walkability, paired with proximity to downtown’s cultural and dining attractions, help support premium pricing well above the US median ADR of $232.
Supply constraints are intensifying. A 21% drop in full-time listings over the past year has not dampened demand, with occupancy up 14% and ADR up 24% year-over-year. The current payback period of about 6.5 years, calculated from active-operator revenue, signals a strong balance of high returns and asset value, despite home prices at $493,511. Most inventory consists of 3-bedroom homes (32 listings), which are well-suited for families and groups, supporting higher nightly rates and annual revenue.
For more on Arlington Park’s seasonality and property mix, review the analytics dashboard.
| Gross yield | 15.8% |
| Annual revenue | $78,200 |
| Active-operator revenue | $75,763 |
| Occupancy | 52% |
| ADR | $314 |
| Median home value (YoY) | $493,511 (-4.8%) |
| Full-time listings | 63 |
Who this market is ideal for: Investors looking for high-dollar bookings in a walkable, central neighborhood with strong long-term demand.
3. Gulf Gate Estates: Steady yield, deep winter bookings, and beach access
Winter travelers drive Gulf Gate Estates’ performance, with occupancy peaking at 76% in March and winter months contributing 33% of annual revenue. This strong seasonal demand is balanced by a sharp September trough at just 23% occupancy, emphasizing the importance of strategic pricing and marketing for off-peak months. The area’s $234 average daily rate aligns closely with the US median, but its 12.4% gross yield ranks in the 78th percentile nationally, outpacing most comparable markets.
Active-operator revenue stands at $39,070, and the typical investor can expect to recoup their purchase price in about 8.2 years, a solid payback horizon given the $319,265 median home value and proximity to Siesta Key. The dominance of 2-bedroom listings (95 in total) offers approachable entry points, while 4-bedroom homes capture the highest annual earnings at $35,923 with a $331 ADR, appealing to larger groups.
Despite a 4% dip in occupancy and a 21% drop in listings over the past year, the market has remained steady thanks to a 23% increase in ADR, showing resilience and pricing power in the face of shifting supply.
Explore the full analytics for Gulf Gate Estates for more on bedroom mix and revenue patterns.
| Gross yield | 12.4% |
| Annual revenue | $39,700 |
| Active-operator revenue | $39,070 |
| Occupancy | 45% |
| ADR | $234 |
| Median home value (YoY) | $319,265 (-11.5%) |
| Full-time listings | 206 |
Who this market is ideal for: Buyers seeking reliable, year-round bookings and proximity to the beach at an accessible price.
4. Alta Vista: High occupancy, compact inventory, and steady returns
Pricing strength in Alta Vista is evident as average daily rates surged 40% year-over-year to $234, outpacing the national median and signaling the neighborhood’s resilience despite a 7.9% drop in home values. Occupancy rates remain robust, peaking at 80% in February when winter demand drives 31% of annual revenue, while even the October low of 44% stays above the US median. This reliable seasonal pattern allows hosts to plan for predictable high-earning months and weather softer periods with confidence.
With just 35 active full-time listings, competition is limited and supports stable returns for committed operators. The 8.9-year payback period, calculated from active-operator revenue, is notably attractive for a centrally located market and reflects the 76th percentile yield performance among over 500 US markets. Inventory tightening, as shown by a 23% drop in listings, has further amplified pricing power and occupancy, making Alta Vista an appealing choice for investors seeking steady, above-median returns in a supply-constrained environment.
The Alta Vista analytics page details seasonal revenue splits and property types.
| Gross yield | 12.0% |
| Annual revenue | $45,300 |
| Active-operator revenue | $42,636 |
| Occupancy | 55% |
| ADR | $234 |
| Median home value (YoY) | $378,450 (-7.9%) |
| Full-time listings | 35 |
Who this market is ideal for: Investors who want a stable, low-competition market with high occupancy and solid ADR growth.
5. Indian Beach Sapphire Shores: Historic charm, winter revenue, and high-end homes
Winter’s strong appeal in Indian Beach Sapphire Shores drives performance, with occupancy soaring to 82% in February and nearly 40% of yearly revenue arriving in the season’s peak. This heavy winter skew is matched by a sharp drop to just 39% occupancy in October, making seasonality a central underwriting factor for any investor considering this district.
The market’s 11.7% gross yield places it in the 75th percentile nationwide, well above the US median of 9.0%, while occupancy also outpaces the national median by 10 percentage points.
With a median home value of $569,317, highest among local peers, investors face a premium buy-in, though the average daily rate sits at $204, trailing the US median. The payback period of 8.7 years on active-operator revenue reflects both the high property values and the concentrated demand window.
Demand has softened recently, as seen in a 7% year-over-year dip in occupancy and a 12% reduction in listings, so buyers should expect heightened volatility and build conservative seasonality into their projections. The dominance of 2-bedroom listings, with 29 active and annual revenue of $30,154 each, suggests a focus on small groups and families seeking a historic, bayfront experience.
The analytics dashboard covers bedroom mix and seasonality in detail.
| Gross yield | 11.7% |
| Annual revenue | $66,900 |
| Active-operator revenue | $65,601 |
| Occupancy | 55% |
| ADR | $204 |
| Median home value (YoY) | $569,317 (-6.7%) |
| Full-time listings | 67 |
Who this market is ideal for: Buyers seeking high winter revenue and historic appeal, with the capital for a premium property.
6. Vamo: Low price, summer-heavy calendar, and sharp swings
Price-sensitive buyers will notice Vamo’s $302,100 median home value, the lowest among Sarasota’s top chalet markets and now off 10.8% year-over-year. The area’s gross yield of 10.7% sits in the 67th percentile of all US short-term rental markets, and while its ADR of $222 nearly matches the national median, occupancy lags at just 29% (well below the US median of 45%).
That low occupancy figure is a direct result of Vamo’s lopsided calendar. July brings a sharp occupancy peak at 54%, but demand collapses to zero in August, creating a highly uneven annual revenue flow.
Winter and spring account for 59% of annual revenue, while summer, despite its July spike, only delivers 22% of the total. Occupancy has fallen by 43% as listings shrank by 14% in the past year, yet ADR jumped 37%, suggesting that operators are resisting price cuts even as demand softens.
With just 36 full-time listings and a payback period of 9.4 years, underwriters should factor in significant risk from month-to-month volatility and be prepared for periods of low or no bookings. Vamo’s inventory skews toward smaller, budget-friendly properties, which appeals to off-the-beaten-path travelers but requires a hands-on approach to navigate the sharp seasonal swings.
For more on Vamo’s seasonality and inventory, visit the Vamo analytics page.
| Gross yield | 10.7% |
| Annual revenue | $32,200 |
| Active-operator revenue | $32,199 |
| Occupancy | 29% |
| ADR | $222 |
| Median home value (YoY) | $302,100 (-10.8%) |
| Full-time listings | 36 |
Who this market is ideal for: Investors seeking a low-cost entry and willing to manage pronounced seasonality and demand swings.
7. Ridge Wood Heights: Spring surge, mid-tier pricing, and rising ADR
Mid-tier pricing and a pronounced spring surge characterize Ridge Wood Heights, where occupancy soars to 76% in March before dipping to just 27% in September. The market’s calendar is shaped by Sarasota’s seasonal appeal, with winter and spring together accounting for 60% of annual revenue. These strong seasonal patterns allow operators to maximize rates during peak months, as reflected in the $244 average daily rate, which stands above the U.S. median of $232.
Recent data shows Ridge Wood Heights in the 64th percentile for gross yield among U.S. Airbnb markets, outperforming the national median of 9.0%. The active full-time operator count is 73, a manageable number that signals moderate competition. The 10-year payback period, calculated from active-operator revenue, offers a balanced entry point for investors seeking reliable mid-term returns.
Occupancy climbed 15% and ADR jumped 36% in the past year, while listings fell 24%, creating a supply squeeze that has strengthened operator pricing power. This combination of rising demand and shrinking supply helps explain the area’s improving revenue performance despite a softening in home values.
See the Ridge Wood Heights analytics for more on property types and revenue breakdowns.
| Gross yield | 10.3% |
| Annual revenue | $35,200 |
| Active-operator revenue | $34,308 |
| Occupancy | 43% |
| ADR | $244 |
| Median home value (YoY) | $342,210 (-8.3%) |
| Full-time listings | 73 |
Who this market is ideal for: Buyers seeking a classic Sarasota calendar and a neighborhood with improving occupancy and ADR trends.
8. Whitfield: Flexible inventory, strong spring, and rising rates
Recent supply constraints have shaped Whitfield’s investment climate, as active listings fell 18% year-over-year while occupancy surged 14% and ADR jumped 27%. Spring is particularly lucrative, with occupancy peaking at 79% in March and ADR reaching $234, while September’s trough at 19% underscores the market’s pronounced seasonality. Winter generates the largest share of annual revenue at 34%, but spring’s 26% cut shows the importance of capitalizing on high-demand months for maximizing returns.
Whitfield’s 9.7% gross yield ranks in the 57th percentile nationally, outpacing the US median and supported by a median occupancy rate of 47%. The payback period sits at 10.9 years, signaling a need for patient capital and a longer-term hold strategy. The inventory’s flexibility is a key underwriting factor.
While most listings are 1-bedrooms, 3-bedroom homes command the highest earnings at $44,783 per year and a $334 ADR, making them attractive for investors seeking greater cash flow in a tightening supply environment. This diversity, paired with Whitfield’s location north of downtown, helps attract both leisure and business guests, driving the market’s resilience despite a 5.5% dip in home values.
For a full breakdown of Whitfield’s bedroom mix and seasonality, check the analytics dashboard.
| Gross yield | 9.7% |
| Annual revenue | $41,900 |
| Active-operator revenue | $39,646 |
| Occupancy | 47% |
| ADR | $217 |
| Median home value (YoY) | $433,919 (-5.5%) |
| Full-time listings | 72 |
Who this market is ideal for: Buyers targeting a diverse inventory and a market with improving occupancy and ADR, especially for larger homes.
9. Southgate: Low occupancy, high ADR, and conservative underwriting
Price trends in Southgate reveal a median home value of $446,754, down 7.8% year-over-year, with a notable 9.6% gross yield that sits at the 57th percentile among 501 US markets.
March brings a surge in demand, with occupancy spiking to 71% and ADR reaching $244, yet the annual average occupancy lags at just 33%, well below the US median of 45%. This pronounced seasonality means winter accounts for 32% of annual revenue, while fall dips to just 21%, and occupancy bottoms out at 15% in September.
Data shows active-operator revenue at $42,302, and it takes roughly 10.6 years of gross income to recoup the median purchase price, an underwriting scenario that demands caution given the persistent low occupancy. The most common property, a 3-bedroom, sees $31,481 per year at a $247 ADR, underscoring the premium achieved even as bookings remain sparse.
The neighborhood has seen occupancy drop by 14%, ADR climb 11%, and listings fall 19% in the past year, signaling that operators are choosing to hold rates steady as supply contracts rather than chasing occupancy at the expense of nightly pricing.
For more on Southgate’s seasonality and property mix, see the Southgate analytics page.
| Gross yield | 9.6% |
| Annual revenue | $43,000 |
| Active-operator revenue | $42,302 |
| Occupancy | 33% |
| ADR | $237 |
| Median home value (YoY) | $446,754 (-7.8%) |
| Full-time listings | 111 |
Who this market is ideal for: Investors prioritizing rate over occupancy, or those with strategies for boosting bookings in a low-occupancy market.
10. South Gate Ridge: Stable occupancy, modest yield, and affordable homes
Market conditions in South Gate Ridge reflect a blend of affordability and steady demand, with a median home value of $344,507, down 10.8% year-over-year, making it accessible for investors compared to pricier Sarasota neighborhoods.
Occupancy performance stands out against the national field, with a 52% median rate that surpasses the US median of 45%, and a March peak of 84% occupancy at a $219 ADR, signaling strong winter and early spring demand. In contrast, September occupancy dips to 33%, mirroring regional seasonal lows, but the area’s overall calendar is balanced, with winter generating 30% of annual revenue and summer close behind at 27%.
Recent trends show tightening supply, as active listings fell 14% year-over-year while occupancy climbed 8% and ADR jumped 13%. This supply squeeze has improved revenue potential and supports the area’s stable gross yield of 8.4%, which places South Gate Ridge in the 43rd percentile among 501 US markets. Underwriting here requires patience.
The payback period stretches to 12.7 years of gross active-operator revenue, the longest among Sarasota’s top neighborhoods. The prevalence of 3-bedroom properties (23 listings, $31,655 annual revenue, $257 ADR) offers a clear benchmark for sizing and income expectations, appealing to buyers who prioritize affordability and a reliable booking pattern across seasons.
For a deeper dive into South Gate Ridge’s seasonality, visit the analytics dashboard.
| Gross yield | 8.4% |
| Annual revenue | $28,900 |
| Active-operator revenue | $27,154 |
| Occupancy | 52% |
| ADR | $211 |
| Median home value (YoY) | $344,507 (-10.8%) |
| Full-time listings | 46 |
Who this market is ideal for: Buyers seeking an affordable entry and consistent bookings in a balanced, mid-tier neighborhood.
How to read these rankings before you buy
Gross yield is a powerful screening tool, but it does not capture every risk or opportunity in a short-term rental market. The headline annual revenue figure averages all listings, while the active-operator benchmark focuses on properties with sustained booking activity, this is the more realistic number for buyers planning to operate full-time. Median ADR and occupancy are computed independently, so multiplying them together will not match the reported revenue.
Buyers should always verify property-level details, as yield can vary widely within a neighborhood based on property type, renovation, and proximity to demand drivers. Seasonality, local regulations, and changes in supply can all impact future returns. Use these rankings as a starting point, but perform due diligence on each property’s unique calendar and competitive set before making an offer.
How to Act on This
Sarasota’s short-term rental market is defined by sharp contrasts in seasonality and price point. Neighborhoods closer to downtown or the bay command higher home values and often see stronger winter and spring demand, while outlying areas offer lower entry costs but may require more active management to smooth out occupancy swings.
Regulation is a key consideration. The City of Sarasota allows short-term rentals in residential zones, but all qualifying vacation rentals must register and comply with local requirements, including obtaining a Vacation Rental Certificate. Sarasota County imposes a 6% Tourist Development Tax, and the state sales tax adds another 7%.
Platforms like Airbnb and Vrbo typically collect and remit these taxes, but owners are responsible for compliance on bookings made elsewhere. Always confirm that your property is in a zone that permits short-term rentals, and check for any new rules before closing.
Look for neighborhoods where supply is tightening, occupancy is stable or rising, and ADR growth is outpacing inflation. Underwrite using active-operator revenue, not just headline numbers, and factor in seasonality to avoid surprises. For buyers ready to take the next step, connect with a Sarasota short-term rental agent who knows the local market and can help you navigate both regulations and revenue potential.