


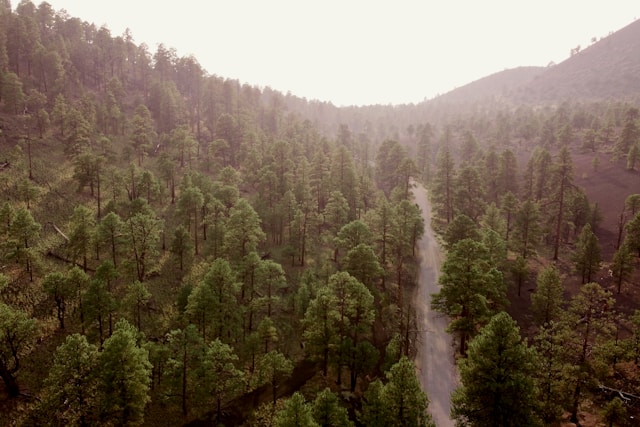
Flagstaff’s short-term rental market is shaped by its geography and guest mix. The city’s top neighborhoods for STRs cluster in more affordable pockets north and west of downtown, where yields reach as high as 10.6%.
According to Chalet Data, entry prices span from just over $410,000 in Sunnyside to more than $800,000 in Ponderosa Trails and Country Club Estates, but gross yields drop off sharply as prices climb. Flagstaff’s citywide gross yield stands at 6.0%, placing it in the 18th percentile of major US STR markets, with occupancy at 46% and a median ADR of $240.
Over the past year, occupancy jumped 16% and ADR rose 12%, even as active listings fell 15%, a clear sign of tightening supply. The neighborhoods that outperform do so by balancing access to attractions, attainable price points, and strong seasonal demand. For buyers, the right fit depends on whether you’re seeking a rate-driven play or steady bookings.
Flagstaff Short-Term Rental Market at a Glance
- Median gross yield: 6.0%
- Annual revenue (headline): $39,900
- Active-operator annual revenue: $38,800
- Median occupancy rate: 46%
- Average daily rate (ADR): $240
- Median home value (Zillow ZHVI): $660,963 (YoY -0.4%)
- Active full-time listings: 1,243
- US gross yield rank: #381 of 501
- Data period is July 2025 – June 2026
The Best Flagstaff Neighborhoods for Airbnb, Ranked by Yield
| Rank | Neighborhood | Gross Yield | Annual Revenue | Median Home Value | ADR | Occupancy | Active Listings |
|---|---|---|---|---|---|---|---|
| 1 | Sunnyside | 10.6% | $43,389 | $410,257 | $161 | 52% | 34 |
| 2 | Tanglewood | 8.0% | $34,434 | $429,871 | $201 | 48% | 32 |
| 3 | University Heights Highlands | 7.2% | $48,461 | $670,636 | $317 | 46% | 44 |
| 4 | Ponderosa Trails | 7.0% | $56,227 | $808,112 | $367 | 29% | 32 |
| 5 | Country Club Estates | 6.6% | $52,602 | $803,000 | $312 | 35% | 67 |
| 6 | South Side | 6.2% | $33,325 | $538,117 | $232 | 44% | 33 |
| 7 | Presidio In The Pines | 5.3% | $33,583 | $636,706 | $291 | 35% | 50 |
| 8 | Flagstaff Townsite | 4.8% | $31,931 | $666,761 | $192 | 59% | 63 |
| 9 | Downtown Flagstaff | 3.9% | $25,961 | $669,485 | $178 | 42% | 42 |
Data as of July 11, 2026. Annual revenue is calculated for each listing as ADR × occupancy × 365, using trailing 12-month data and reported as the median for each neighborhood. ADR and occupancy are shown independently. Multiplying these will not reproduce the revenue figure, as revenue is computed at the listing level.
Gross yield divides the median revenue by the median home value (Zillow ZHVI). See methodology for details. The active-operator revenue benchmark filters to listings with sustained booking activity, this is the more reliable basis for underwriting. The headline revenue averages all listings regardless of activity.
1. Sunnyside: Highest Yield, Accessible Entry
Flagstaff’s top performer for STR yield is Sunnyside, where the numbers speak for themselves. Gross yield hits 10.6%, well above the city’s 6.0% mark and the US median of 9.0%. Median home values are the lowest on this list at $410,257, and that affordability is a key reason Sunnyside tops the yield charts. Occupancy peaks at 72% in August, while winter dips to 32% in February, so timing matters for maximizing bookings.
This neighborhood’s guest base is broad, drawing in travelers seeking proximity to downtown and Northern Arizona University without paying downtown premiums. ADR is a modest $161, lower than the city and national medians, but high occupancy and a compressed supply (listings down 19% year-over-year) keep cash flow strong. Seasonal revenue is well balanced, with fall and summer each contributing over a quarter of annual earnings.
Payback on a typical Sunnyside STR is just over 10 years of gross active-operator revenue, far shorter than the city average. For buyers, this is a rare combination. Low entry price, high occupancy, and a neighborhood that’s still seeing ADR climb rapidly (up 28% year-over-year). For a deeper dive into Sunnyside’s numbers, visit the Sunnyside analytics page.
| Gross yield | 10.6% |
| Annual revenue | $43,389 |
| Active-operator revenue | $40,819 |
| Occupancy | 52% |
| ADR | $161 |
| Median home value (YoY) | $410,257 (-2.7%) |
| Full-time listings | 34 |
Who this market is ideal for: Buyers seeking strong cash flow and quick payback on a lower-cost Flagstaff property.
2. Tanglewood: Consistent Returns in a Family Setting
Tanglewood stands out for its stability and family appeal. Gross yield here is 8.0%, putting it above both the city and national medians. Occupancy reaches 68% in August, with a November low of 34%, so summer is the clear high season. The average daily rate sits at $201, which is below the city’s highest earners but still delivers solid annual revenue of $34,434.
This neighborhood’s homes are typically two-bedroom properties, making them a good fit for families and small groups. Tanglewood’s home values are moderate at $429,871, and the payback period is about 12.7 years, attractive for buyers who want reliable returns without the volatility of pricier Flagstaff markets. The most common listing type is a two-bedroom, which earned $28,254 over the past year at a $213 ADR.
Demand has softened slightly, with occupancy down 7% year-over-year, but ADR has climbed 7% and supply has dropped 22%. This suggests less competition and more pricing power for committed operators. For more details on Tanglewood’s performance, the Tanglewood analytics page breaks down the numbers by property size and season.
| Gross yield | 8.0% |
| Annual revenue | $34,434 |
| Active-operator revenue | $33,722 |
| Occupancy | 48% |
| ADR | $201 |
| Median home value (YoY) | $429,871 (-0.9%) |
| Full-time listings | 32 |
Who this market is ideal for: Buyers seeking a steady, family-friendly STR in a low-volatility Flagstaff neighborhood.
3. University Heights Highlands: High Revenue, Premium Rates
University Heights Highlands is the revenue leader among Flagstaff’s STR markets, with the median listing grossing $48,461 annually. The neighborhood’s ADR is a standout at $317, far above the city and US medians. Occupancy hits a summer high of 75% in August before dipping to 37% in January, so operators should plan for a pronounced seasonal swing.
Home values are higher here at $670,636, but the gross yield remains a solid 7.2%. The payback period is about 13.8 years, which is competitive for a neighborhood with such strong nightly rates. The local guest profile includes university visitors, families, and groups attending events, all of whom value the neighborhood’s proximity to NAU and easy access to major routes.
Momentum is positive. Occupancy jumped 28% year-over-year, ADR rose 13%, and supply is stable. This blend of high rates and rising demand makes University Heights Highlands a compelling choice for buyers who can underwrite at the active-operator level. The analytics page for University Heights Highlands offers more insight into property mix and booking patterns.
| Gross yield | 7.2% |
| Annual revenue | $48,461 |
| Active-operator revenue | $48,461 |
| Occupancy | 46% |
| ADR | $317 |
| Median home value (YoY) | $670,636 (+0.1%) |
| Full-time listings | 44 |
Who this market is ideal for: Buyers targeting high nightly rates and larger homes near the university and event venues.
4. Ponderosa Trails: High ADR, Low Occupancy, A Rate-Driven Play
Ponderosa Trails is a study in contrasts. This neighborhood commands the highest ADR in Flagstaff at $367, with annual revenue for the median listing at $56,227. Occupancy, however, is just 29%, the lowest on the list, and peaks at 65% in July before dropping to 23% in April. This is a classic rate-driven market, where operators rely on premium bookings rather than steady occupancy.
Home values are steep at $808,112, and the payback period stretches to 14.4 years. The guest profile here often includes larger families and groups, drawn by the spacious homes and proximity to trails and parks. Over the past year, ADR surged 37% while occupancy fell 18%, and supply contracted by 19%. This pattern suggests that operators who can capture peak-season demand will outperform, but the risk of shoulder-season vacancy is real.
For buyers comfortable with seasonality and high entry costs, Ponderosa Trails can deliver impressive gross revenue. To explore the nuances of this neighborhood’s STR performance, see the Ponderosa Trails analytics for full details.
| Gross yield | 7.0% |
| Annual revenue | $56,227 |
| Active-operator revenue | $56,227 |
| Occupancy | 29% |
| ADR | $367 |
| Median home value (YoY) | $808,112 (+2.1%) |
| Full-time listings | 32 |
Who this market is ideal for: Investors seeking high gross revenue and willing to manage pronounced seasonality and vacancy risk.
5. Country Club Estates: Golf Community with Steady Demand
Summer drives the short-term rental story in Country Club Estates, with occupancy peaking at 67% in July and summer bookings accounting for 31% of annual revenue. Spring and winter each contribute 25% to the yearly total, but April marks the low point for occupancy at just 24%.
The $312 average daily rate here sits well above the US median of $232, but the neighborhood’s 35% occupancy lags the national median by 10 points, reflecting its clear emphasis on peak-season demand rather than year-round stays.
With a median home value of $803,000 and a payback horizon of around 15.8 years, investors face a longer path to recoup their purchase price compared to many US markets, as the 6.6% gross yield places Country Club Estates in just the 22nd percentile nationally.
The active-operator annual revenue of $50,948 is solid for Flagstaff, but the high buy-in price and seasonal nature of bookings mean buyers must underwrite conservatively. Recent trends show a 3% rise in occupancy, a 26% surge in ADR, and a 24% drop in listings, tightening supply and giving committed hosts greater pricing power, especially in the high-demand summer window.
Country Club Estates is best suited to buyers looking for a stable, higher-end STR with strong summer demand and a family-oriented guest base. To see how property size impacts revenue here, review the Country Club Estates analytics.
| Gross yield | 6.6% |
| Annual revenue | $52,602 |
| Active-operator revenue | $50,948 |
| Occupancy | 35% |
| ADR | $312 |
| Median home value (YoY) | $803,000 (+1.5%) |
| Full-time listings | 67 |
Who this market is ideal for: Buyers seeking a golf community with proven summer revenue and a longer-term investment horizon.
6. South Side: Central Location, Moderate Returns
Pricing holds steady in South Side, where the median gross yield of 6.2% places this neighborhood in the 20th percentile of 501 US markets, trailing the national median of 9.0%. Occupancy rates reflect a classic college-town rhythm, surging to 74% in July as summer travelers arrive, then dipping to 35% in February when demand ebbs. Summer accounts for 33% of annual revenue, while winter brings 24%, making seasonality a key driver for STR investors here.
Active full-time listings have tightened by 16% over the past year, yet occupancy and ADR both increased (up 4% and 5% respectively), which signals that demand remains robust even as supply contracts. The payback period is about 17.2 years based on active-operator revenue, so buyers should expect moderate but stable returns rather than rapid recoupment of capital.
The dominance of two-bedroom properties (20 listings, $22,878 annual revenue) suggests a sweet spot for small groups or families seeking walkable access to downtown, NAU, and Flagstaff’s dining scene. This dynamic helps explain why South Side’s numbers are steady. Its central location reliably draws guests, supporting consistent bookings even as broader market yields lag national peers.
South Side is a fit for buyers who want a central Flagstaff address and are comfortable with moderate but reliable returns. More details on property mix and booking trends are available on the South Side analytics page.
| Gross yield | 6.2% |
| Annual revenue | $33,325 |
| Active-operator revenue | $31,371 |
| Occupancy | 44% |
| ADR | $232 |
| Median home value (YoY) | $538,117 (+2.2%) |
| Full-time listings | 33 |
Who this market is ideal for: Investors prioritizing walkability and consistent bookings over maximum yield.
7. Presidio In The Pines: Newer Builds, Supply Squeeze
Summer’s arrival transforms Presidio In The Pines into a hotspot, with July occupancy soaring to 67% and contributing to a robust 35% of annual revenue during the season. By contrast, November brings a sharp pullback, dropping occupancy to 22% and highlighting the pronounced seasonality that shapes revenue patterns here. This dynamic means owners must plan for strong cash flow in peak months while weathering slower periods as part of their underwriting strategy.
With a median gross yield of 5.3%, Presidio In The Pines sits in the 12th percentile among 501 US markets, trailing the US median of 9.0%. The nearly 20-year payback period reflects both high home values, currently $636,706, down 3.2% year-over-year, and a tight supply, as listings fell 24% in the past year.
This supply squeeze, paired with a 16% jump in occupancy and a 15% rise in ADR, gives active operators pricing power, especially for the most common three-bedroom homes, which earned $30,677 annually at a $290 ADR. The numbers reflect strong demand for newer construction, but also the need for patience and careful planning in a competitive, seasonal market.
Presidio In The Pines is best for buyers seeking newer construction and who can underwrite for seasonality. For a closer look at the market’s supply and demand dynamics, see the Presidio analytics page.
| Gross yield | 5.3% |
| Annual revenue | $33,583 |
| Active-operator revenue | $32,115 |
| Occupancy | 35% |
| ADR | $291 |
| Median home value (YoY) | $636,706 (-3.2%) |
| Full-time listings | 50 |
Who this market is ideal for: Buyers who want newer homes and are prepared for a long-term hold in a tightening market.
8. Flagstaff Townsite: High Occupancy, Modest Yield
Occupancy rates in Flagstaff Townsite lead the local market, averaging 59% and peaking at 74% in August, when summer tourism fills calendars and even the slowest winter month of January holds at a respectable 49%.
This seasonal resilience helps keep vacancy risk low, but gross yields land at just 4.8%, placing Townsite in the 9th percentile nationally compared to the US median of 9.0%. Despite the lower yield, this neighborhood’s occupancy strength stands out against the US field, as its 59% median rate is well above the 45% national median.
Investors should note that the payback period stretches to 21.4 years at current median prices, the longest among Flagstaff’s STR options, reflecting high home values ($666,761, up 6.8% YoY) relative to rental income. Most listings are compact one-bedrooms (35 out of 63), which earned $23,907 at a $155 ADR last year, but two-bedrooms outperform on revenue, capturing $28,804 at $217 ADR.
A dramatic 80% surge in occupancy and 8% ADR growth over the past year, combined with an 11% drop in listings, has created a supply squeeze that favors committed operators able to capture rising demand.
Flagstaff Townsite is best suited to buyers prioritizing steady bookings and low vacancy, even if yields are modest. For a full breakdown of occupancy and property mix, check the Flagstaff Townsite analytics.
| Gross yield | 4.8% |
| Annual revenue | $31,931 |
| Active-operator revenue | $31,147 |
| Occupancy | 59% |
| ADR | $192 |
| Median home value (YoY) | $666,761 (+6.8%) |
| Full-time listings | 63 |
Who this market is ideal for: Buyers who want maximum occupancy and are comfortable with lower headline yields.
9. Downtown Flagstaff: Central, But Pricey
Market dynamics in Downtown Flagstaff reflect both premium pricing and intense demand for central locations. Occupancy saw a striking 41% jump year-over-year in June 2026, while average daily rates climbed 14% and active listings contracted by 17%. This supply squeeze has kept revenue buoyant, but with a median gross yield of just 3.9%, placing Downtown in the bottom 5th percentile among 501 US markets and well below the 9.0% national median, investors face a challenging entry point.
Seasonal patterns are moderate, with occupancy peaking at 50% in October and dipping to 30% in May, and annual revenue distributed fairly evenly across summer (26%), fall (26%), and winter (25%). The lengthy 26.1-year payback period is a direct result of high home values ($669,485, up 4.4% YoY) paired with only modest rental income, making underwriting especially sensitive to future appreciation or operational improvements.
The market’s most common listing is a one-bedroom, accounting for over half the inventory, but these units earned just $14,140 last year at a $152 ADR, underscoring the need for careful revenue forecasting in this central but costly Flagstaff enclave.
More on the downtown STR landscape is available on the Downtown Flagstaff analytics page.
| Gross yield | 3.9% |
| Annual revenue | $25,961 |
| Active-operator revenue | $25,609 |
| Occupancy | 42% |
| ADR | $178 |
| Median home value (YoY) | $669,485 (+4.4%) |
| Full-time listings | 42 |
Who this market is ideal for: Buyers who value a central address and are prepared for a long-term hold with modest cash flow.
How to read these rankings before you buy
Gross yield is a quick way to compare STR markets, but it tells only part of the story. It divides the median listing’s gross annual revenue by the median home value, before expenses or financing. Headline revenue includes all listings, while the active-operator benchmark filters for those with sustained booking activity, this is a more realistic basis for underwriting. Occupancy and ADR are reported independently, so multiplying them won’t match the revenue figure, which is calculated at the listing level.
Neighborhood-level rankings highlight where the numbers are strongest, but property-level diligence is essential. Seasonality, property type, and guest demand can vary within the same block. Use these rankings to narrow your search, but always verify projected returns on the specific property you’re considering.
How to Act on This
Flagstaff’s STR market is shaped by both regulation and guest demand. As of November 2023, the City of Flagstaff requires all short-term rental owners to obtain a Short Term Rental License, renewed annually for $250. You’ll also need a Transaction Privilege Tax (TPT) license from the Arizona Department of Revenue and must notify neighbors annually with your contact information. Operating without a license can result in city enforcement, so compliance is a must.
Flagstaff’s transient occupancy tax applies to STRs at the same rate as hotels, and owners are responsible for collecting and remitting both state and city taxes. The city prohibits nonresidential uses and special events at STR properties, so be sure your rental plan aligns with local code. Always confirm the latest requirements directly with the city before you close.
On the buying side, seasonality is a real factor, summer and fall are the busiest, but winter bookings can be meaningful in high-occupancy neighborhoods. Underwrite using active-operator revenue and payback years, not just headline yield. Consider your preferred guest segment and property type, as demand varies sharply by location and season. For expert guidance, connect with a Flagstaff STR agent who knows the local landscape.