Monthly Occupancy Rate
Annual avg 54% · peaks at 68% in Aug
68% (Aug)
Summer peak
54%
Annual avg



Airbnb Market Analytics & Investment Insights
Go Deeper
Open a conversation with your preferred assistant, pre-loaded with a question about this topic.
Information provided is for educational purposes only and does not constitute financial, legal, or investment advice.
Score a specific Columbus address against revenue, occupancy, and yield benchmarks.
Columbus's ADR rises 44% from Jan ($130) to Aug ($187), but occupancy rises 1.5× in the same window. The revenue lever here is occupancy capture, not pricing — set rates competitively in shoulder months to maximize summer bookings, then push ADR aggressively in peak months when demand is inelastic.
| $164 |
| $34,761 |
3 Bedroom | 484 | 55% | $225 | $45,296 |
4 Bedroom | 235 | 55% | $327 | $65,716 |
5 BedroomRecommended | 83 | 59% | $405 | $87,351 |
Columbus is primarily a drive market — demand is regional and less exposed to airline disruptions or fuel-price spikes, which supports more stable occupancy year-round.
| Rank | Neighborhood | Gross Yield | Annual Revenue | Listings | Median Home Value |
|---|---|---|---|---|---|
| 1 | Far South | 47% | $98,540 | 4 | $209K |
| 2 | East Columbus | 19% | $26,064 | 6 | $136K |
| 3 | Franklinton | 18% | $32,430 | 31 | $177K |
| 4 | South Side | 18% | $29,667 | 125 | $162K |
| 5 | North Linden | 18% | $32,692 | 32 | $185K |
| 6 | Milo Grogan | 16% | $24,600 | 9 | $154K |
| 7 | Olentangy West | 15% | $50,186 | 18 | $328K |
| 8 | South Linden | 14% | $18,226 | 18 | $134K |
| 9 | Westland | 13% | $28,007 | 2 | $220K |
| 10 | Mid East | 12% | $24,782 | 43 | $201K |
| 11 | West Scioto | 11% | $41,261 | 6 | $387K |
| 12 | Far North | 11% | $26,721 | 4 | $252K |
| 13 | Greater Hilltop | 10% | $21,849 | 12 | $220K |
| 14 | Near East | 10% | $31,901 | 169 | $333K |
| 15 | Clintonville | 9% | $45,288 | 77 | $478K |
| 16 | Northland | 9% | $26,640 | 57 | $283K |
| 17 | Livingston Avenue Area | 9% | $17,143 | 41 | $184K |
| 18 | Harrison West | 9% | $33,026 | 18 | $368K |
| 19 | Fifth By Northwest | 8% | $24,243 | 43 | $285K |
| 20 | Far Northwest | 8% | $29,273 | 6 | $356K |
| 21 | University District | 8% | $29,470 | 279 | $369K |
| 22 | Victorian Village | 8% | $33,797 | 89 | $429K |
| 23 | Rocky Fork Blacklick | 8% | $19,369 | 7 | $247K |
| 24 | Italian Village | 7% | $33,144 | 128 | $457K |
| 25 | South East | 7% | $20,393 | 9 | $290K |
| 26 | Hayden Run | 7% | $32,872 | 3 | $474K |
| 27 | Downtown | 7% | $22,616 | 82 | $345K |
| 28 | German Village | 6% | $35,299 | 55 | $553K |
| 29 | Brewery District | 6% | $21,726 | 9 | $343K |
| 30 | Northeast | 6% | $15,247 | 18 | $246K |
| 31 | Northwest | 5% | $13,017 | 13 | $248K |
| 32 | Southwest | 5% | $8,524 | 2 | $172K |
Annual average is 50%, rising to 68% in August and dipping to 43% in June.
August, July, August are peak months, with ADR averaging $187 and occupancy reaching 68% in August.
$251,291, down 0.90% year-over-year.
1 Bedrooms are the most popular property type with 927 active listings — strong balance of acquisition cost and revenue.
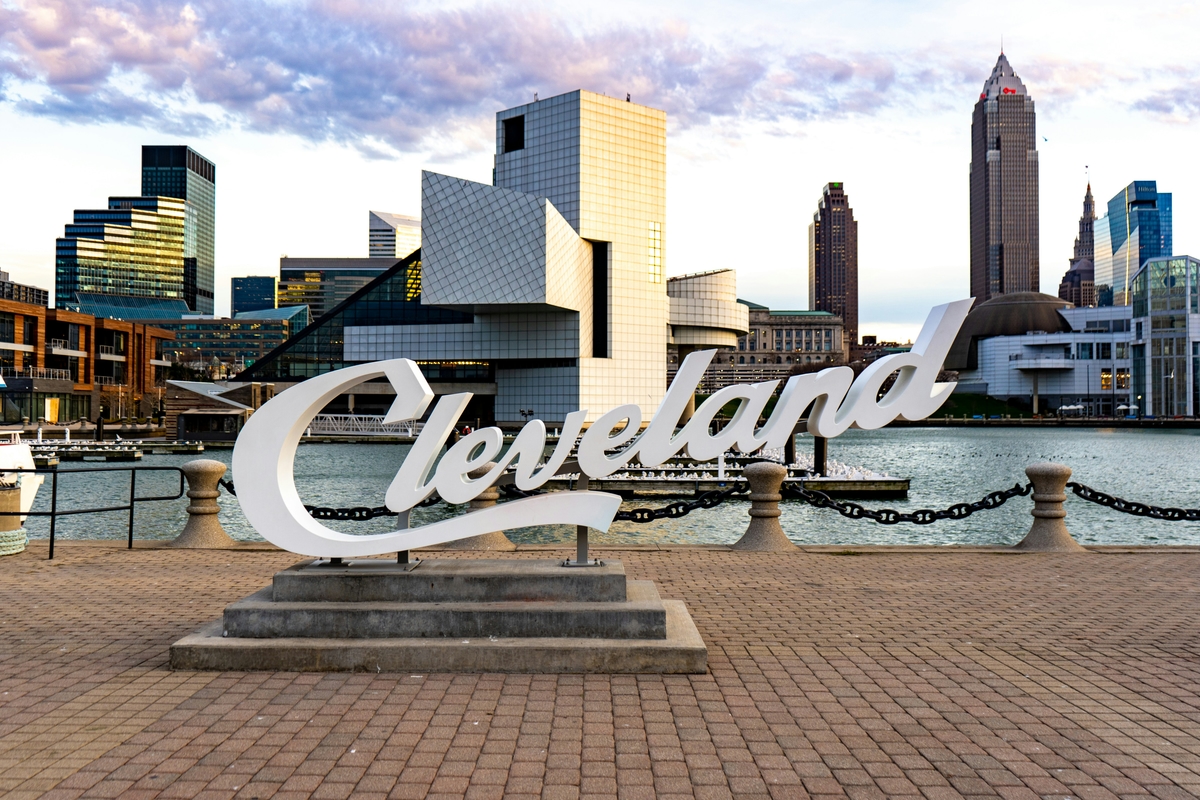
Top guest origin cities are Columbus, OH (7.17% of bookings), Cincinnati, OH (3.69% of bookings), Cleveland, OH (3.58% of bookings).
1,481 active short-term rental listings — split across studio (64), 1 bedroom (927), 2 bedroom (600), 3 bedroom (484), 4 bedroom (235), 5 bedroom (83).