Monthly Occupancy Rate
Annual avg 39% · peaks at 56% in Jul
56% (Jul)
Summer peak
39%
Annual avg



Airbnb Market Analytics & Investment Insights
Go Deeper
Open a conversation with your preferred assistant, pre-loaded with a question about this topic.
Information provided is for educational purposes only and does not constitute financial, legal, or investment advice.
Quarterly average across active listings
Score a specific Logan address against revenue, occupancy, and yield benchmarks.
Logan's ADR rises 28% from Sep ($296) to Jul ($378), but occupancy rises 2.2× in the same window. The revenue lever here is occupancy capture, not pricing — set rates competitively in shoulder months to maximize summer bookings, then push ADR aggressively in peak months when demand is inelastic.
| $286 |
| $45,112 |
3 Bedroom | 166 | 37% | $390 | $53,258 |
4 Bedroom | 100 | 32% | $550 | $64,707 |
5 BedroomRecommended | 64 | 30% | $743 | $82,091 |
Logan relies heavily on fly-in guests — demand may be more sensitive to airfare changes, airline route cuts, and economic downturns that reduce discretionary travel.
Annual average is 38%, rising to 64% in August and dipping to 26% in February.
August, July, July are peak months, with ADR averaging $260 and occupancy reaching 64% in August.
$271,284, up 4.83% year-over-year.
2 Bedrooms are the most popular property type with 265 active listings — strong balance of acquisition cost and revenue.
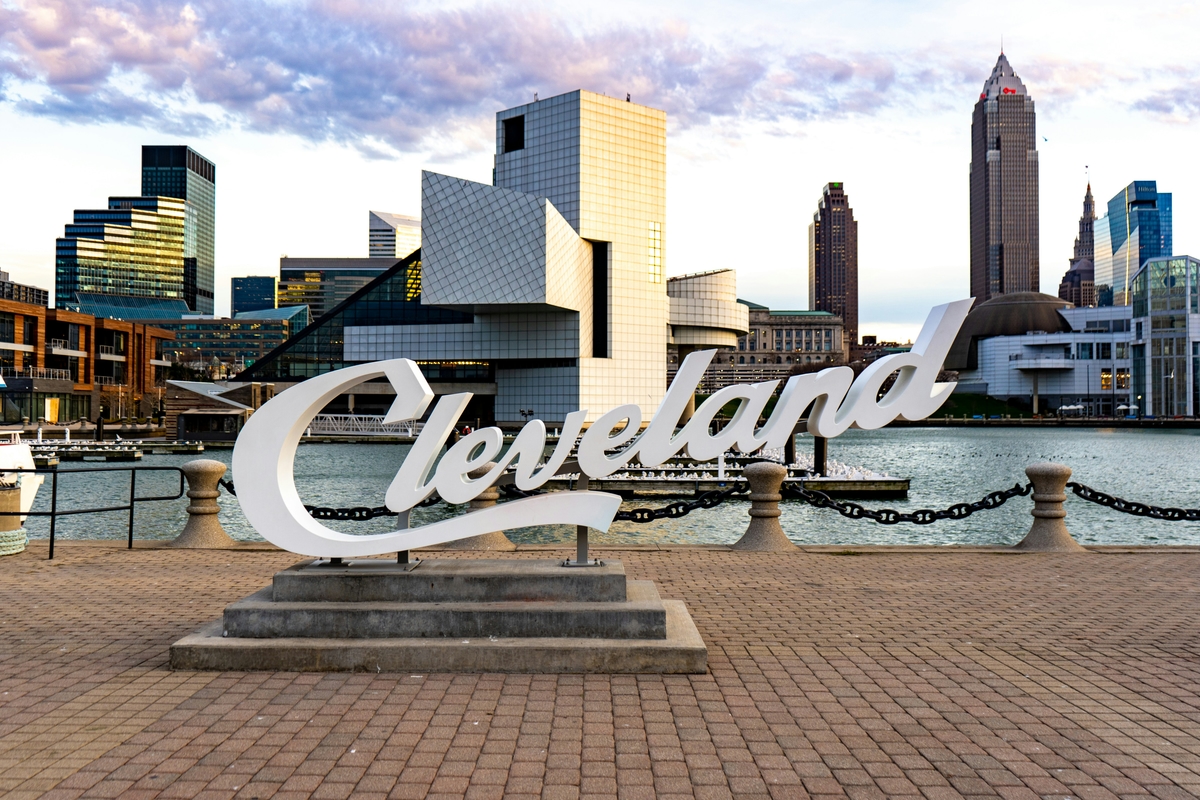
Top guest origin cities are Columbus, OH (10.00% of bookings), Cincinnati, OH (5.21% of bookings), Cleveland, OH (3.47% of bookings).
680 active short-term rental listings — split across studio (15), 1 bedroom (230), 2 bedroom (265), 3 bedroom (166), 4 bedroom (100), 5 bedroom (64).