Airbnb market dataThrough 2,404 listingsHow we measure
Yes, with caveats. Hollywood, FL’s whole-market median annual revenue is $54,745, with a median occupancy of 58% and ADR of $277 (Chalet data).
Buying in Hollywood?Free, with no obligation
Written from an earlier data window, so some figures differ from the live numbers above.
Chalet AI
A typical active Hollywood Airbnb earned $54,745 in the 12 months to Sep 2026. The top 25% of listings averaged $95,237, about 1.7× that. The bottom 25%, which includes rarely booked listings, averaged $3,682.
$3.7k
Bottom 25% average
$54.7k
Typical listing
$95.2k
Top 25% average
1-bedroom homes are the most common in Hollywood (43% of listings).
| Bedrooms | Share of listings | Nightly rate | Occupancy | Est. revenue/yr |
|---|---|---|---|---|
| Studio | 8% | $157 | 61% | $34,955 |
| 1 bedroom | 43% | $177 | 60% | $38,555 |
| 2 bedrooms | 28% | $319 | 55% | $63,714 |
| 3 bedrooms | 11% | $403 | 56% | $82,779 |
| 4 bedrooms |
Estimated revenue = nightly rate × occupancy × 365, last 12 months.
Have a property in mind?
Estimate its revenue, costs and cash flow with Hollywood's numbers.
The best three months, Mar, Feb and Jan, brought in 35% of a typical Hollywood listing's revenue over the 12 months to Sep 2026.
Mar brings in 2.8× as much as Sep
Typical monthly revenue per listing, Oct 2025–Sep 2026
| Month | Revenue | Occupancy | Nightly rate | Revenue a year earlier |
|---|---|---|---|---|
| Oct 2025 | $3,050 | 51% | $193 | |
| Nov 2025 | $3,472 | 58% | $215 | |
| Dec 2025 | $5,094 | 61% | $277 | |
| Jan 2026 | $5,979 | 73% | $310 | |
| Feb 2026 | $6,035 | 80% | $356 | |
| Mar 2026 | $7,241 | 83% | $360 | |
| Apr 2026 |
Park Side has the highest gross yield of the 11 Hollywood neighborhoods we rank, at 18.2%, with typical revenue of $41,722 a year.
| # | neighborhood | Gross yield | Revenue/yr | Occupancy | Home value |
|---|---|---|---|---|---|
| 1 | Park Side | 18.2% | $41,722 | ||
| 2 | Driftwood | 13.6% | $65,027 | ||
| 3 | South Central Beach | 13.4% | $54,331 | ||
| 4 | Hollywood Lakes | locked | locked | locked | locked |
| 5 | Hollywood Hills | locked | locked | locked | locked |
| 6 | Boulevard Heights | locked | locked | locked | locked |
| 7 | Highland Gardens | locked | locked | locked | locked |
| 8 | North Central | locked | locked | locked | locked |
| 9 | Royal Poinciana | locked | locked | locked | locked |
and 2 more neighborhoods
Ranked by gross yield (typical yearly revenue ÷ median home value), last 12 months. 20 neighborhoods have fewer than 20 listings or incomplete data and aren't ranked.
Yield isn't everything: zoning and HOA rules decide which streets allow short-term rentals.
The median Hollywood home is worth $444,268 (Zillow, Aug 2026), down 2.3% in a year. At typical revenue that's a 12.3% gross yield, before the mortgage, taxes and running costs.
Yes, Airbnbs are legal in Hollywood, FL, but they require city, county, and state licenses and must comply with strict operational rules.
Yes, you need a City of Hollywood Vacation Rental License, along with other required licenses, to operate an Airbnb in Hollywood, FL.
The total effective lodging tax for STRs in Hollywood, FL is 12% (6% state + 6% county).
The 10 largest operators in Hollywood each ran 40 or more listings as of May 2025.
and 3 more
Of guests from the top 10 cities, 49% live within a day's drive. Guests book 56 days ahead on average.
and 3 more
Hollywood ranks #15 of the 73 Florida markets we track by gross yield.
| # | Market | Gross yield | Revenue/yr | Home value |
|---|---|---|---|---|
| 1 | Deerfield Beach, FL | 18.5% | $50,521 | |
| 2 | Delray Beach, FL | 17.0% | $58,242 | |
| 3 | Hallandale Beach, FL | 16.7% | $46,311 | |
| 4 | Panama City, FL | 16.0% | $45,401 | |
| 5 | Largo, FL | 14.5% | $48,908 | |
| 6 | Pensacola, FL | 14.5% | $38,588 | |
| 7 | Fort Walton Beach, FL | 14.2% | $45,733 | |
| 8 | Seminole, FL | 13.7% | $52,966 | |
| 15 | Hollywood, FL (this market) | 12.3% | $54,745 |
None listed in Hollywood right now, so here are others in Florida.
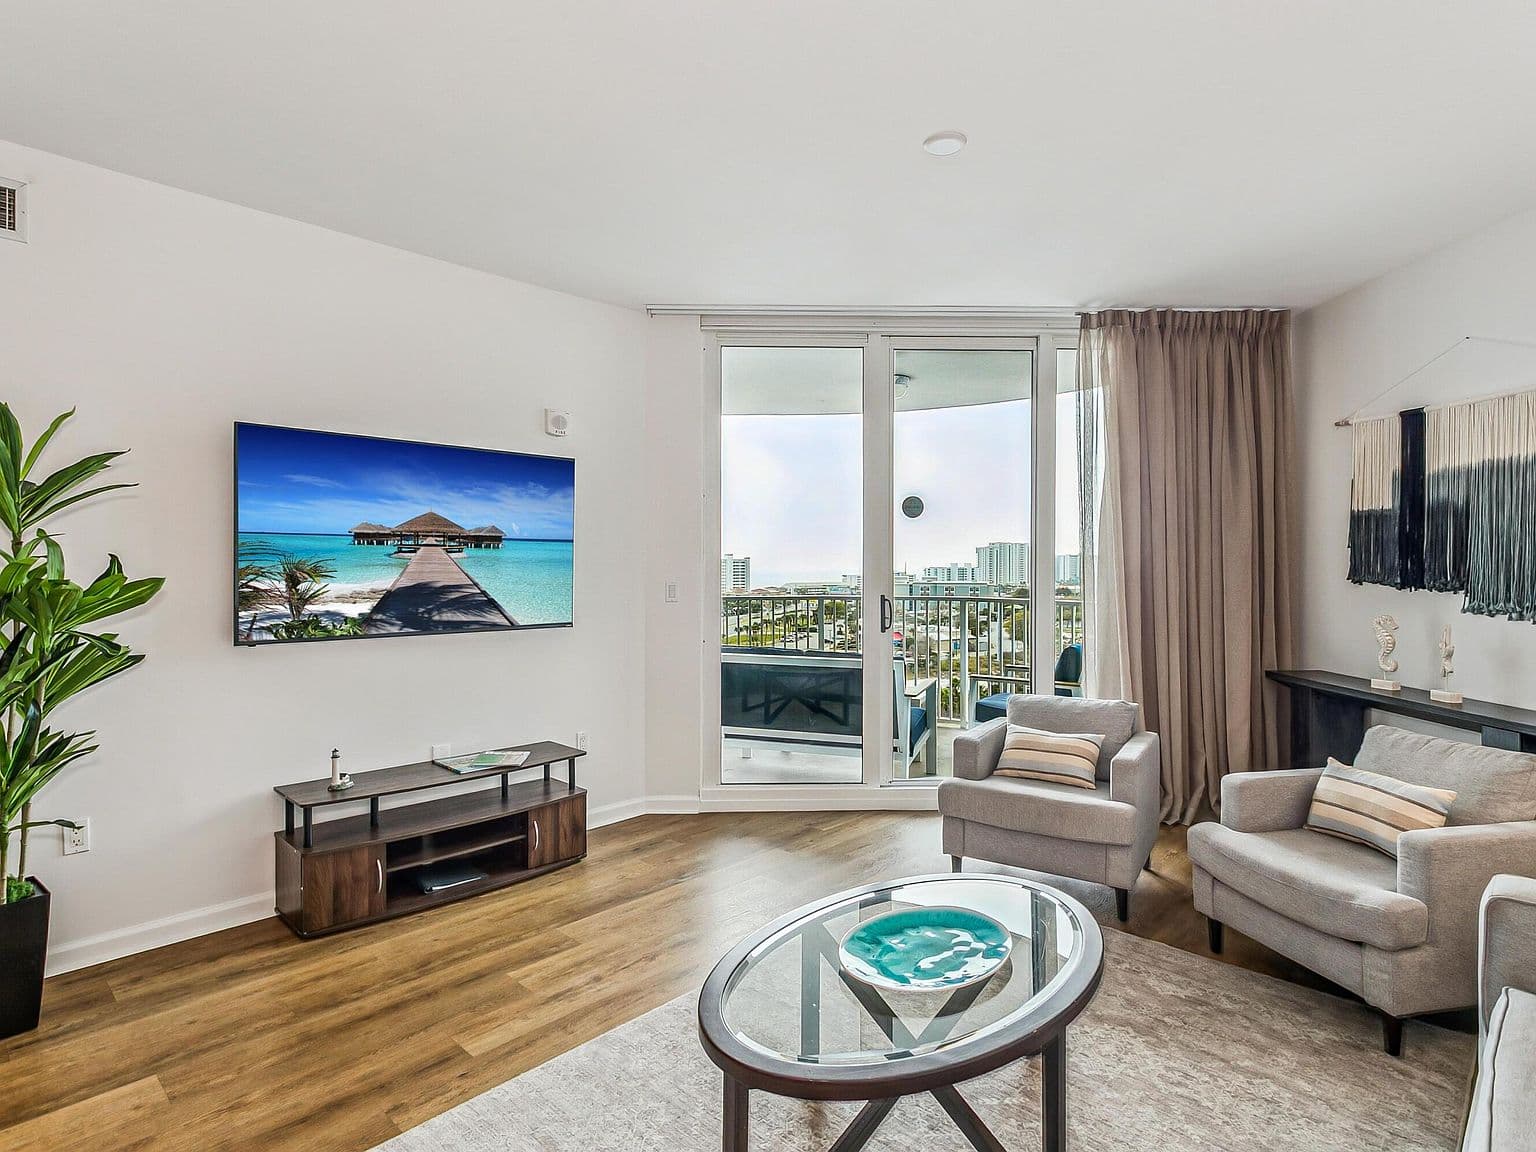
$324,900
4203 Indian Bayou Trl #11013, Destin, FL, 32541
2 bd · 2 ba · 970 sq ft
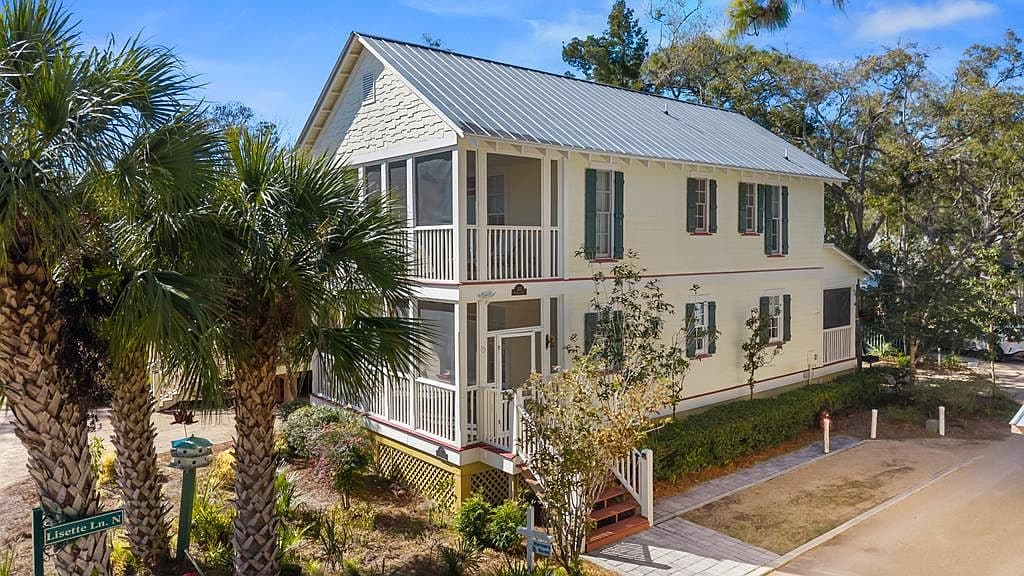
$549,900
307 Winslow St, Steinhatchee, FL, 32359
2 bd · 3 ba · 1,980 sq ft
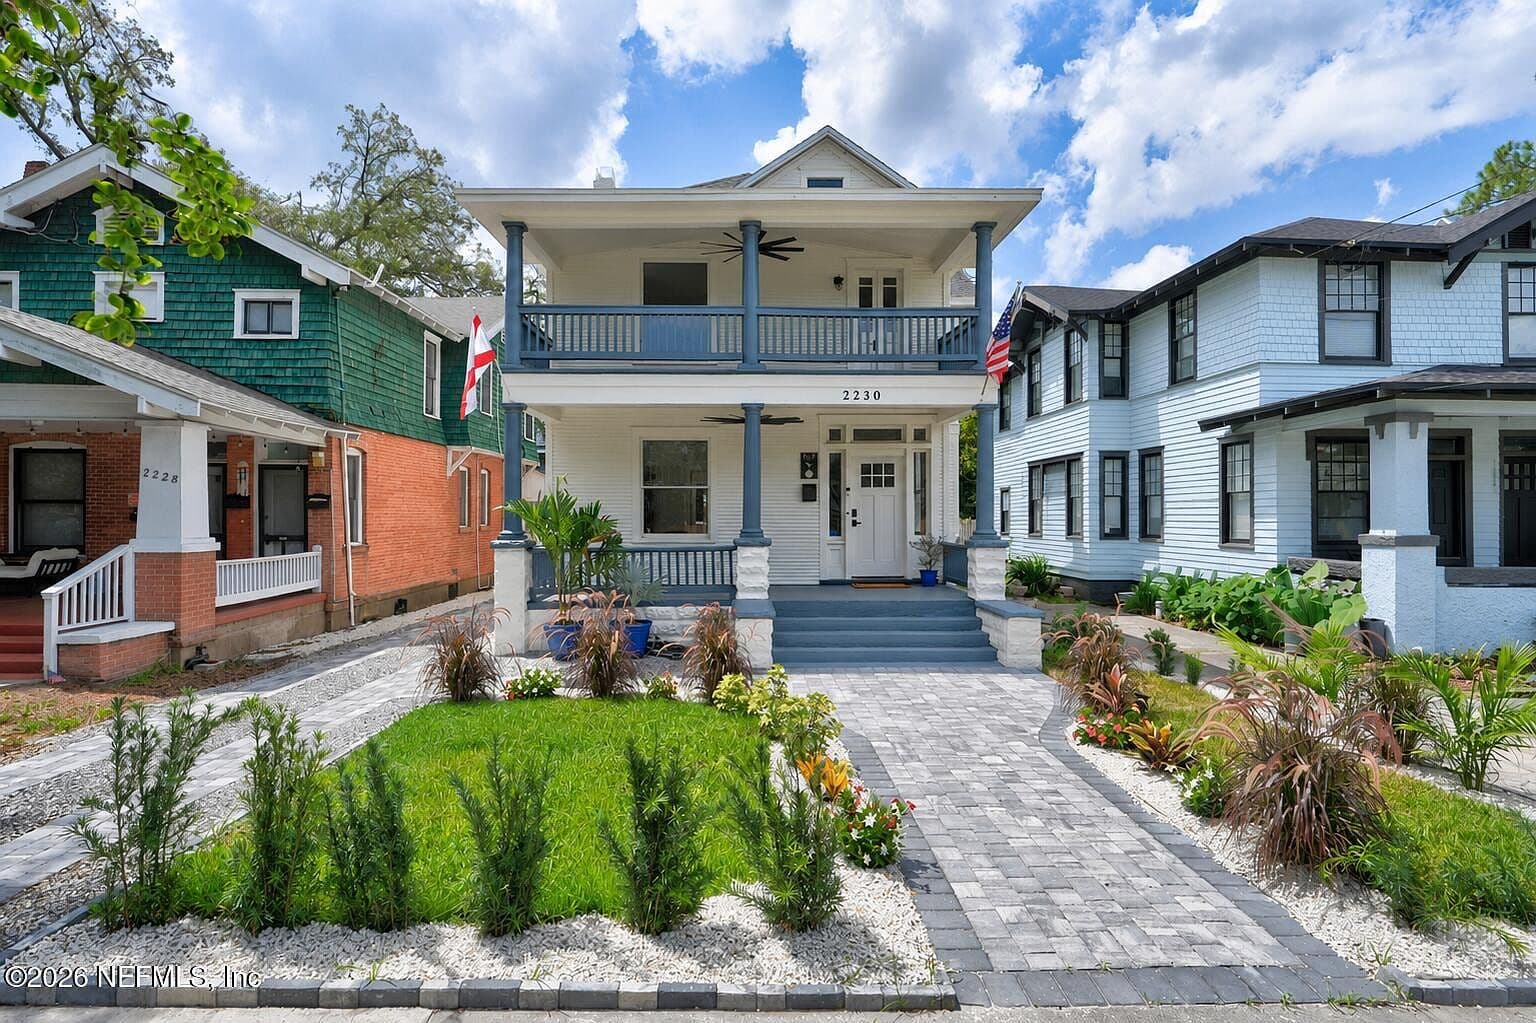
$674,990
2230 POST Street, Jacksonville, FL, 32204
4 bd · 3 ba · 2,312 sq ft
Buying here?
A Hollywood STR agent knows which properties and streets work as short-term rentals.
Selling a Hollywood Airbnb?
Get matched with a listing agent who sells short-term rentals here.
Need financing?
DSCR lenders qualify you on the property's projected rental income.
A typical active Airbnb in Hollywood, FL earned $54,745 in the 12 months to Sep 2026. The median listing was booked 58% of nights, and the average nightly rate was $277 in Sep 2026. Against a median home value of $444,268, that's a 12.3% gross yield before the mortgage, taxes and running costs.
A typical active listing earned $54,745 in the 12 months to Sep 2026. The top 25% of listings averaged $95,237 and the bottom 25% $3,682. Estimated by size: 1-bedroom about $38,555; 2-bedroom about $63,714; 3-bedroom about $82,779 and 4-bedroom about $105,452 a year.
The typical listing was booked 58% of nights in the 12 months to Sep 2026, from 83% in March to 39% in September.
March; February and January earned the most, bringing in 35% of a typical listing's revenue in the 12 months to Sep 2026.
$444,268 as of August 2026 (Zillow Home Value Index), down 2.3% in a year.
1-bedroom homes make up 43% of listings, earning an estimated $38,555 a year.
The top origin cities are Miami, FL (4.3% of guests); New York, NY (3.7% of guests) and Buenos Aires, Argentina (2.5% of guests). Of guests from the top 10 cities, 49% live within a day's drive.
Chalet tracks 2,404 short-term rental listings in Hollywood, FL, with data through Sep 2026.
Based on 2,404 Hollywood short-term rental listings tracked by Chalet, with data through Sep 2026. Home values come from the Zillow Home Value Index.
Airbnb data sites count different things. Some average every listing, including ones that are rarely booked; some use a whole metro area instead of the town; some use a calendar year. We show typical figures for active listings in Hollywood over the last 12 months, and label each number with what it counts. Compare like with like before comparing sites.
For education only, not financial, legal or investment advice. Full methodology
| $512 |
| 56% |
| $105,452 |
| 5 bedrooms | 3% | $606 | 56% | $123,833 |
|---|
| $5,139 |
| 67% |
| $311 |
| May 2026 | $4,251 | 58% | $265 |
|---|
| Jun 2026 | $4,291 | 50% | $314 |
|---|
| Jul 2026 | $4,476 | 57% | $305 |
|---|
| Aug 2026 | $3,131 | 46% | $233 |
|---|
| Sep 2026 | $2,586 | 39% | $206 |
|---|