


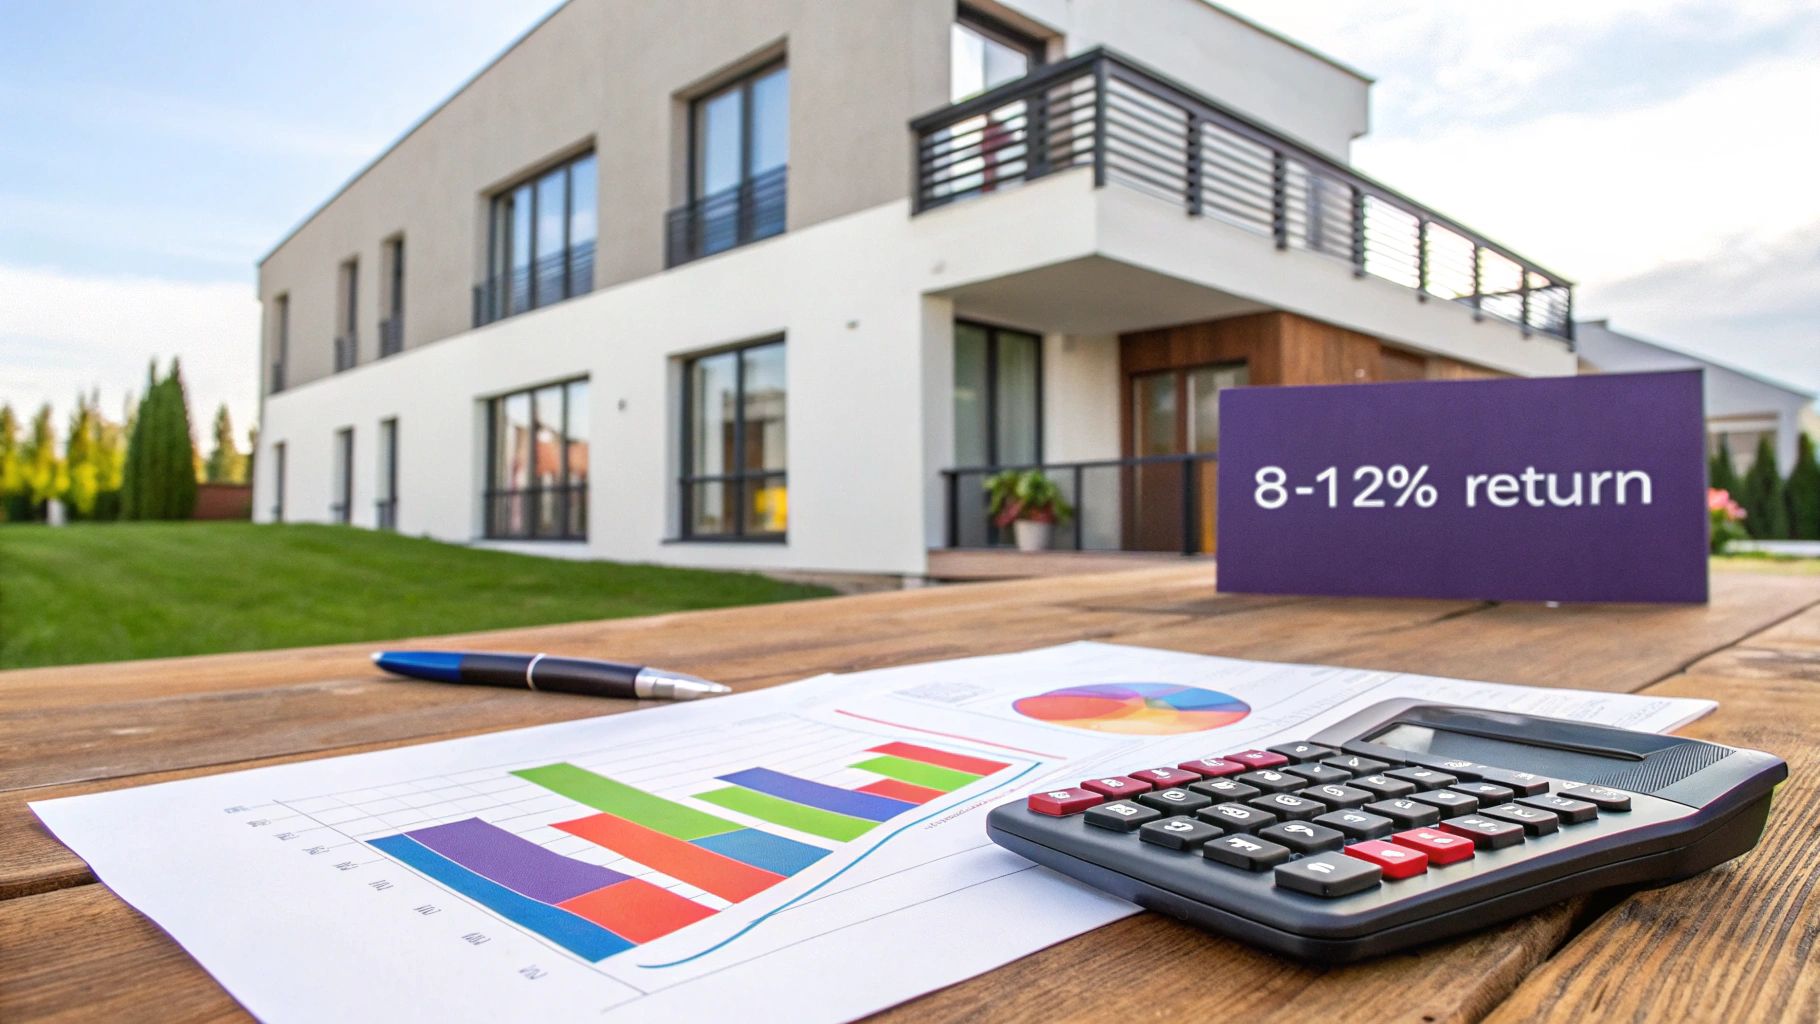
Ask ten different investors what a "good" cash on cash return is, and you'll likely get ten different answers. While the industry benchmark often lands somewhere between 8% to 12%, the truth is, there's no magic number.
The best way to think about it is as the annual return you're getting on the actual cash you pulled out of your pocket to buy the property.
What Defines a Good Cash on Cash Return
While that 8% to 12% range is a solid starting point, what makes a return good is entirely personal. If you’re a conservative investor in a stable, low-risk market, a 7% return might feel like a huge win. On the flip side, an investor taking on a fixer-upper in an up-and-coming neighborhood might be aiming for 15% or more to make the extra risk and headache worthwhile.
The real strength of this metric is its raw simplicity. It cuts through the noise of things like property appreciation or future tax benefits and focuses on one thing: how hard your cash is working for you right now. This makes it an invaluable tool for quickly comparing different deals, especially when you're using leverage.
Setting Realistic Benchmarks
To ground your expectations, it helps to look at typical returns across different property types. While every market is unique, these ranges give you a general idea of what to expect.
A quick look at benchmarks can help you see where your potential STR investment might fit in.
Cash on Cash Return Benchmarks by Property Type
| Property Type | Typical Cash on Cash Return Range |
|---|---|
| Single-Family Rentals (SFR) | 3% – 8% |
| Short-Term Rentals (STR) | 8% – 15%+ |
| Multifamily (2-4 Units) | 5% – 10% |
| Commercial Real Estate | 8% – 12% |
As you can see, short-term rentals often have the potential for higher returns, but this also reflects the more active management and market volatility involved. Discover more insights about comparing real estate return metrics on 1031crowdfunding.com.
Ultimately, your "good" number will come down to a few key factors:
- Your Investment Strategy: Are you playing the long game for stable cash flow, or are you looking for a quick, high-return project?
- Risk Tolerance: Higher returns almost always come with higher risks, like unpredictable vacancy rates or surprise maintenance bills.
- Market Conditions: A property in a hot, appreciating market might justify a lower initial cash on cash return because you're banking on future growth.
A good cash on cash return is simply one that hits your personal financial goals and pays you fairly for the risk you're taking. It's the number that tells you your capital is in the right place, working for you.
How to Calculate Your Cash on Cash Return
Figuring out this key metric is much simpler than it sounds. At its heart, the formula just looks at how much actual cash your investment spits out each year compared to the cash you had to put in to get it. It’s a clean, powerful way to see how your property is really performing.
You only need two numbers to get started:
- Annual Pre-Tax Cash Flow: This is the money left in your pocket after a full year. Take your total rental income, then subtract all your operating expenses and your annual mortgage payments.
- Total Cash Invested: This is every single dollar you paid out of pocket to get the deal done. It includes your down payment, all closing costs, and any money you spent on repairs or furniture to make the place guest-ready.
The Formula in Action
To get your return, you simply divide your annual cash flow by the total cash you invested.
Cash on Cash Return = (Annual Pre-Tax Cash Flow / Total Cash Invested) x 100
Multiplying by 100 just turns the number into a percentage, which makes it easy to understand at a glance. This single figure tells you exactly how hard your invested cash is working for you, year after year.
This graphic breaks down how to pull the right numbers together for the calculation.
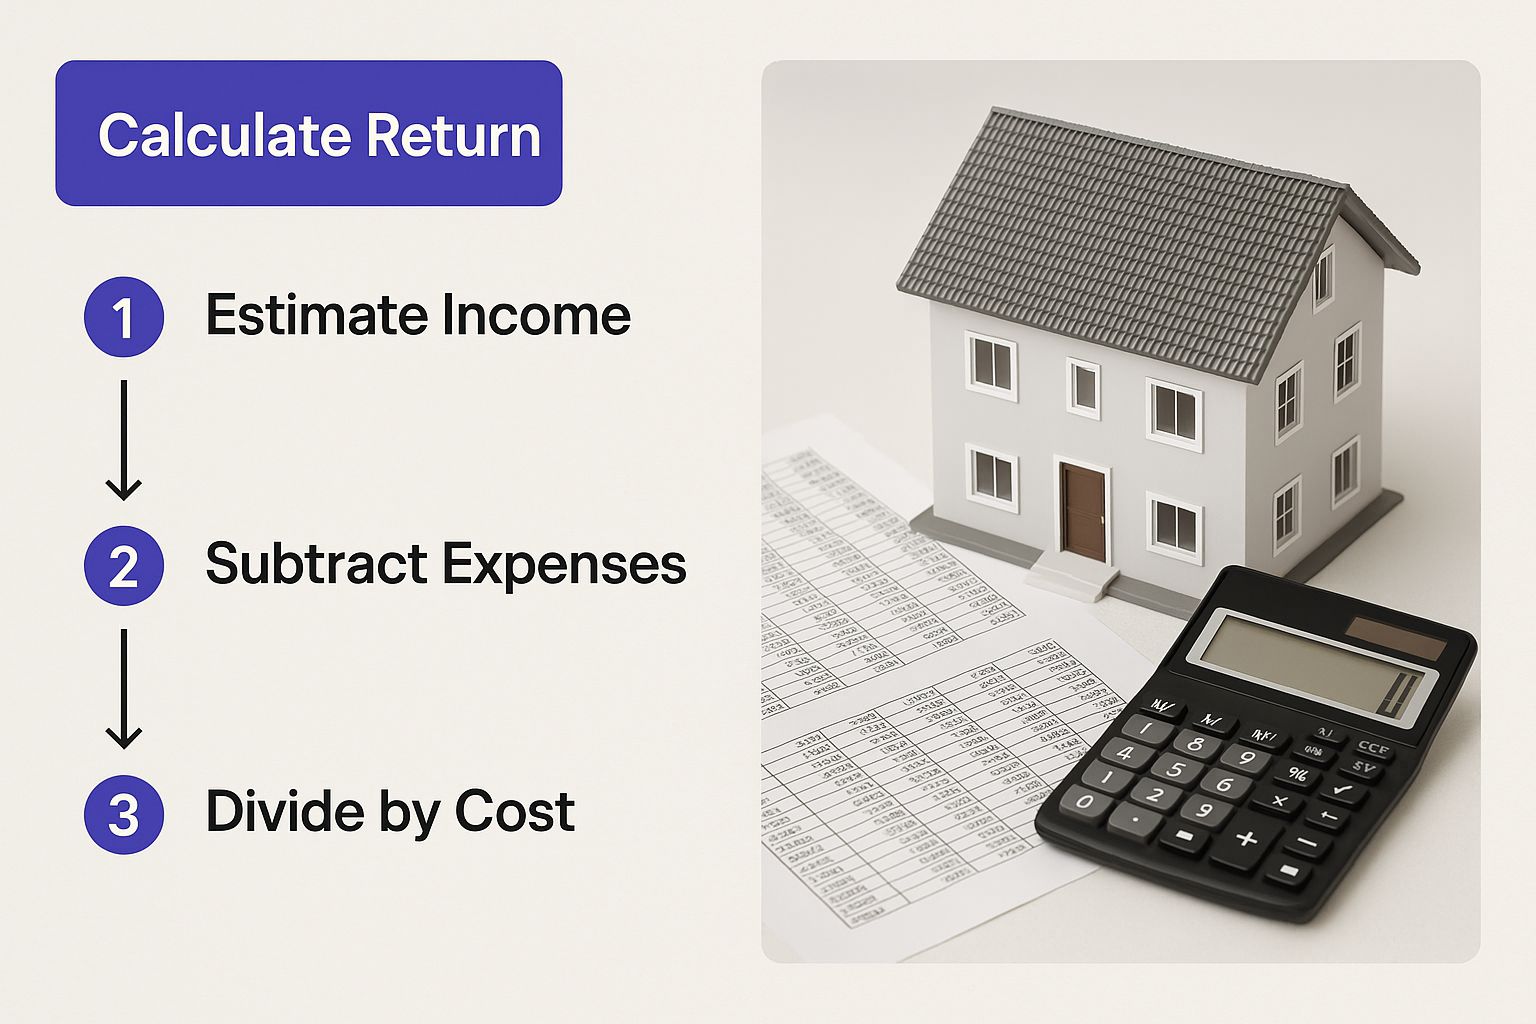
As the visual shows, it’s all about the direct relationship between what you put in (your cash outlay) and what you get out (your ongoing cash flow). Those are the only two pieces of the puzzle.
A Practical Example
Let's walk through a real-world scenario with a duplex to make it crystal clear.
- Total Cash Invested: You put $80,000 down and paid another $5,000 in closing costs. You also had to sink $15,000 into initial repairs. Add it all up, and your total cash invested is $100,000.
- Annual Pre-Tax Cash Flow: The property brings in $40,000 in gross rent for the year. After you pay $28,000 to cover the mortgage, taxes, insurance, and other operating costs, you're left with $12,000 in annual pre-tax cash flow.
Now, we just plug those numbers into our formula:
($12,000 / $100,000) x 100 = 12% Cash on Cash Return
To get this calculation right, it’s absolutely critical that you first understand what is cash flow in real estate and how to find that number accurately. The 12% return in this example is strong—definitely hitting the higher end of what most investors would consider a great cash on cash return.
Using Leverage to Amplify Your Returns
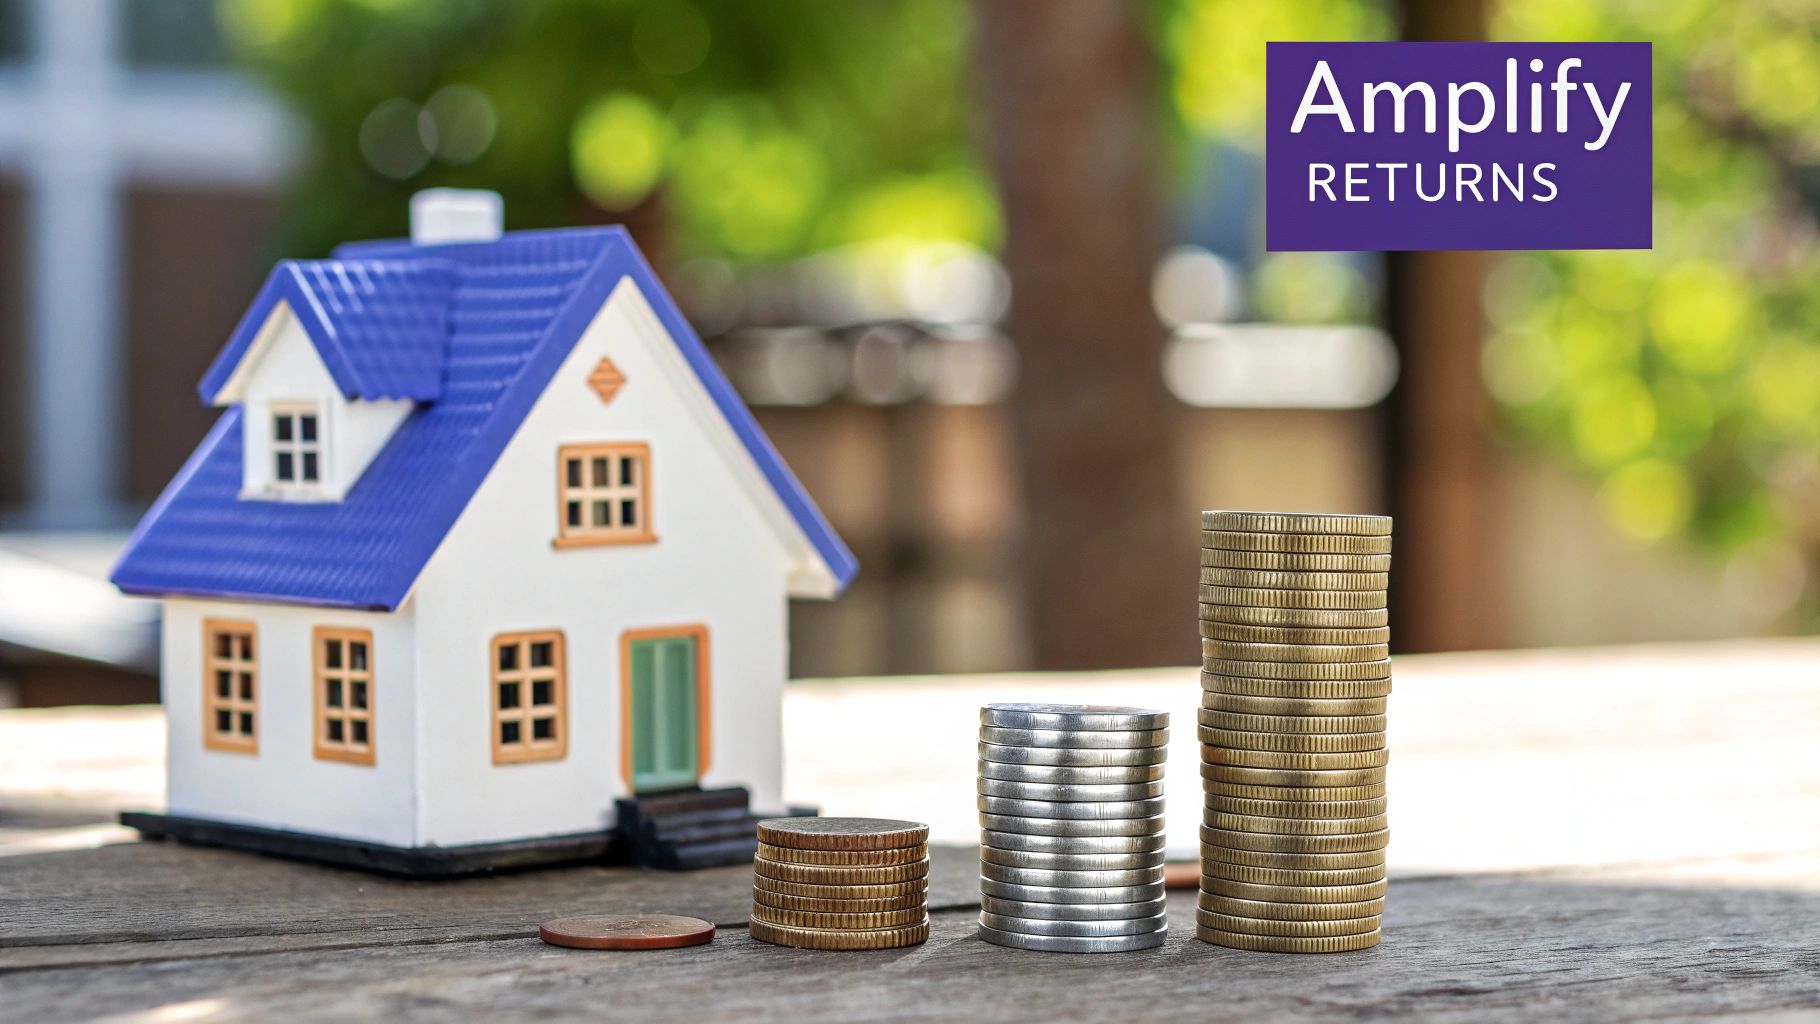
This is where the cash on cash return metric really shines. It perfectly illustrates the power of leverage—using other people's money (like a bank loan) to magnify your own potential profits. For nearly all real estate investors, this means getting a mortgage to buy a property.
Let's imagine two investors eyeing identical properties, both listed at $500,000. One investor decides to pay all cash. The other puts down 20% ($100,000) and finances the rest.
Even if both properties generate the exact same rental income, their cash on cash returns will look wildly different. Why? Because the second investor has far less of their own skin in the game. Their annual profit is measured against a much smaller pile of their own cash, which sends their return percentage through the roof.
A Tale of Two Investments
Let's run the numbers to see how this plays out. Assume both $500,000 properties bring in $40,000 in net operating income (NOI) before any mortgage payments.
- All-Cash Investor: They put in $500,000 and get $40,000 back each year. Simple math gives them an 8% cash on cash return ($40,000 / $500,000).
- Leveraged Investor: They only invested $100,000 out of pocket. Their $40,000 NOI has to cover their annual mortgage payments—let's say that's $25,000. This leaves them with $15,000 in pre-tax cash flow. Their cash on cash return is 15% ($15,000 / $100,000).
Think about that for a second. Even after paying the bank, the leveraged investor almost doubles their return. They're using the lender's money to generate a much higher return on their own capital. This is the fundamental reason why most savvy investors choose to finance properties.
This isn’t just theory. Real-world data shows that leveraging a deal can dramatically boost returns. A property bought with a loan might hit a 10% return, while the same property paid for in cash could yield just 6.7%. You can learn more by decoding real estate return metrics on CrowdStreet.com.
This principle is called positive leverage, and it's the secret sauce for building wealth in real estate. It happens when the return your property generates is higher than the interest rate on your loan. When you nail this, you unlock the ability to build your portfolio faster and with less of your own money on the line.
What Moves the Needle on Your Return Rate?
A property’s cash on cash return isn’t some fixed number etched in stone. It’s a living, breathing metric that flexes based on a handful of real-world variables. Think of it like a recipe—adjusting any one ingredient can completely change how it tastes. If you want to project your returns accurately and make smarter bets, you need to understand what those ingredients are.
So, what makes one short-term rental a cash-flow machine while an identical one next door is just scraping by? It all boils down to a few critical levers you can pull.
Market and Location Dynamics
You’ve heard it a million times: location, location, location. And for good reason—it has a direct line to your wallet. A property in a hot tech city might pull in incredible nightly rates, but you’ll also get hit with sky-high property taxes and insurance. On the flip side, a cabin in a quieter, more affordable area might have lower income potential but comes with way fewer operating headaches.
Your specific market sets the rules for several key numbers:
- Rental Demand: High-demand tourist spots or cities with booming job markets can support higher occupancy and premium nightly rates. It's just simple supply and demand.
- Property Taxes: These can be shockingly different from one county to the next, taking a huge bite out of your gross income before you see a dime.
- Local Regulations: Never underestimate the impact of local rules. Licensing fees, occupancy taxes, or strict STR ordinances can pile on extra costs you didn't budget for.
Property Type and Condition
Let's be clear: not all properties are created equal. You could buy a turnkey, fully-furnished STR that starts earning from day one, but it probably doesn't leave much room to add value. Or, you could scoop up a fixer-upper at a discount, giving you a golden opportunity to force appreciation and boost rental income through smart renovations. That sweat equity can dramatically pump up your cash on cash return once the dust settles.
The property's condition when you buy it directly impacts your "Total Cash Invested." A lower initial repair budget keeps this number down, making it much easier to hit a higher return percentage on your annual cash flow.
Financing and Management
The loan you get is one of the most powerful levers you have. A lower interest rate or a smaller down payment (which means more leverage) can seriously amplify your returns. Just think about it: if you lock in a loan with a 4.5% interest rate instead of 5.5%, that entire 1% savings goes straight into your pocket, year after year.
Finally, your management style is a huge piece of the puzzle. Self-managing can save you the typical 8-10% fee a property manager charges, which is a direct boost to your cash flow. But don't fool yourself—effective self-management is a real job. It takes time and skill to master marketing, guest communication, and coordinating maintenance.
Putting Cash on Cash Return in Context
While Cash on Cash Return is a fantastic tool for gauging immediate cash flow, relying on it alone is like trying to navigate with just a compass. Smart investors know you need a full dashboard of metrics to truly understand a deal’s health.
To get the complete picture, it’s crucial to see how this metric works alongside two other industry cornerstones: Capitalization Rate (Cap Rate) and Return on Investment (ROI). Think of these three as different lenses for viewing the same property. Each one reveals something unique that the others might miss.
Comparing Key Investment Metrics
To make this crystal clear, let's break down how each metric functions and when you'd want to use it.
Investment Metrics at a Glance
| Metric | What It Measures | Includes Financing? | Primary Use Case |
|---|---|---|---|
| Cash on Cash Return | The annual return on your actual cash invested. | Yes | To evaluate the performance of your down payment and closing costs. It's your personal return. |
| Cap Rate | The raw, unleveraged annual return of a property. | No | To compare the inherent profitability of different properties on an apples-to-apples basis. |
| ROI (Return on Investment) | The total return over the entire holding period, including profit from the sale. | Yes | To get the "big picture" scorecard of your investment after it's sold, factoring in appreciation and equity. |
Let’s dig a little deeper into what this table tells us.
Cap Rate is the purest measure of a property's earning power, stripped of any financing details. You simply divide the Net Operating Income (NOI) by the purchase price. This is your go-to metric for comparing the raw potential of different properties, answering the question, "How much does this asset earn all on its own?"
Return on Investment (ROI), on the other hand, gives you the 30,000-foot view over your entire ownership journey. Unlike Cash on Cash Return, ROI includes the profit you make from the property's sale (appreciation) and the equity you've built by paying down your loan. It’s the final scorecard after the game is over.
The key difference is focus: Cash on Cash measures yearly cash flow performance, Cap Rate assesses a property’s inherent profitability, and ROI calculates your total profit over the long term.
Understanding the broader investment landscape is also valuable. A comprehensive 145-year study found that rental properties delivered an average annual return of about 7.05%, slightly edging out stocks.
For those looking to deepen their understanding, exploring additional insights and real estate investment strategies can provide practical examples and broader perspectives. By using these metrics together, you move from just calculating a number to truly understanding an investment.
Got Questions About Cash on Cash Return? We’ve Got Answers.
Once you start using this metric, a few practical questions always pop up. Getting them answered is the key to analyzing your next short-term rental deal with confidence and sidestepping the common traps.
Let’s tackle the ones we hear most often from investors.
Does Cash on Cash Return Include Property Appreciation?
No, and it's super important to remember this. Cash on cash return is a pure performance metric. It’s laser-focused on one thing: the cash your property generates each year compared to the actual cash you pulled out of your pocket to buy it.
Think of it as a "here and now" snapshot of your investment's moneymaking ability. It totally ignores any potential gains from the property's value going up over time. That long-term wealth building is captured by other numbers, mainly your total Return on Investment (ROI), when you eventually sell.
Can My Cash on Cash Return Change Over Time?
Absolutely. Your return is a living number, not a "set it and forget it" figure. It can—and probably will—change from year to year.
A few things can make it move:
- More Revenue: If you bump up your nightly rates or nail down higher occupancy, your cash flow grows, and so does your return.
- Rising Costs: When property taxes, insurance, or HOA fees creep up, your cash flow shrinks, dragging your return down with it.
- Refinancing: Changing your mortgage can dramatically alter your annual loan payments, which directly hits your final cash flow calculation.
Is a Higher Cash on Cash Return Always Better?
Not always. While a big number looks great on paper, it can sometimes be a red flag for higher risk. A property in a rougher part of town might advertise a 20% cash on cash return, but it could come with the headaches of high vacancy, constant repairs, and problem guests.
The smart move is to find a balance. Aim for a solid return that matches a risk level you're comfortable with, instead of just chasing the highest percentage you can find.
What Is the Difference Between Cash on Cash Return and ROI?
Here’s a simple way to think about it: cash on cash return is your property's yearly check-up. ROI is the final report card you get after you sell.
Cash on cash gives you that tight, focused look at annual cash flow performance. ROI, on the other hand, is a much bigger-picture metric. It calculates your total profit over the entire life of the investment, factoring in all the cash flow you earned, the equity you paid down, and the final profit from appreciation.
Ready to find your next high-performing short-term rental? Chalet provides the free tools and expert network you need to analyze markets, find properties, and invest with confidence. Explore our data-driven dashboards and connect with STR-specialist agents today at https://www.getchalet.com.


