


At its core, rental property cash flow analysis is just a fancy way of asking: "Will this property make me money, or will it bleed me dry?" It's the process of adding up all your expected income and subtracting all your anticipated costs.
Doing this gives you the financial heartbeat of your investment. It's the one number that tells you if a property will generate a real, spendable monthly profit or just become another hole in your bank account.
Why Cash Flow Is the Lifeblood of Your Rental

It’s easy for new investors to get fixated on appreciation—the hope that a property's value will climb over time. While that’s a fantastic long-term perk, appreciation doesn’t pay this month's mortgage. It doesn't cover the water heater that just burst or put groceries on your table. That's cash flow's job.
Think of it like this: a property with strong, positive cash flow is a healthy fruit tree. The tree itself grows in value (that's your appreciation), but it also gives you a predictable harvest of fruit season after season. That reliable income is what builds sustainable wealth and gives you real financial breathing room.
The Core Principle of Cash Flow
When you boil it all down, the concept is incredibly simple. A proper cash flow analysis is what separates a true asset from a sneaky liability.
- Positive Cash Flow: Your property brings in more money than it costs to run each month. This surplus is pure profit in your pocket.
- Negative Cash Flow: The property's expenses are higher than its income, meaning you have to dip into your own funds just to keep it afloat.
Even with all the economic curveballs thrown our way in recent years, rental properties have proven to be a surprisingly durable investment. We’ve seen reports showing that rentals kept churning out stable cash flow while other asset classes were taking a nosedive, which only solidifies their reputation as a solid hedge against inflation.
A solid rental property cash flow analysis is your financial roadmap. It helps you steer clear of costly mistakes and points you directly toward the properties that actually build wealth. It’s what allows you to stop guessing and start investing with confidence.
If you're looking to get a firmer grip on this, check out this guide on understanding the core concept of real estate cash flow. It does a great job of breaking down the numbers and turning what seems like a complex formula into your most powerful tool.
Building Your Realistic Income Projections

When you're running the numbers on a potential rental, it's incredibly tempting to just plug in the monthly rent, multiply by twelve, and call it a day. But that's one of the biggest—and most common—traps new investors fall into. A truly solid income projection goes way beyond the base rent to capture every single dollar the property can realistically generate.
Think of your property as its own small business. The rent is your main product, sure, but there are almost always other revenue streams. Ignoring them leaves money on the table and gives you a skewed financial picture from the very start.
Gross Potential vs. Effective Gross Income
To build a forecast you can actually count on, you have to get familiar with two key ideas. The first is Gross Potential Income (GPI). This is the absolute maximum your property could earn in a perfect world—100% occupancy, every tenant paying on time, every single month. It's the best-case, pie-in-the-sky scenario.
But we don't invest in a perfect world. That's where Effective Gross Income (EGI) comes in, and it's the number that really matters. EGI is simply your GPI minus the real-world costs of vacancies and any rent you couldn't collect. This is the income you can actually expect to see in your bank account. Overestimating your income is the fastest way to turn a promising deal sour; EGI keeps your feet on the ground.
Your Effective Gross Income is the foundation of your entire analysis. If you get this number wrong, every calculation that follows—from Net Operating Income to your final cash flow—will be completely off.
Identifying All Your Revenue Streams
To get an accurate GPI, you need to think beyond just the rent. What are all the ways this property can make money?
- Monthly Rent: This is your bread and butter, the primary income from tenants.
- Pet Fees: A lot of landlords now charge a one-time fee or monthly "pet rent." With over 66% of U.S. households owning a pet, this is a huge and growing income source.
- Parking Fees: Is parking scarce in the area? Offering reserved or covered spots for a monthly fee can be a steady moneymaker.
- Laundry Income: In multi-family properties, on-site, coin-operated laundry can generate a surprising amount of extra cash. Don't overlook it.
- Late Fees: You never want to collect them, but late payment penalties are a potential income stream that needs to be factored into your "what-if" projections.
Accounting for Vacancy
Here's a hard truth: no property stays occupied 100% of the time. People move out. It takes time to clean, make repairs, and find a new, qualified tenant. That downtime is your vacancy rate, and you absolutely must account for it.
Don't just guess. Do some local market research. A hot, in-demand area might have a vacancy rate around 5%, while a slower, less competitive market could be closer to 10%. Check reports from local property managers or jump into real estate investment forums for your city to find reliable data. Once you have a realistic rate, you subtract that loss from your GPI. The result is a much more dependable income figure to build the rest of your cash flow analysis on.
Uncovering Every Hidden Property Expense
So you’ve got a realistic income forecast. That's a great start. Now comes the part where many investors trip up: uncovering every single cost tied to owning the property. It’s a fatal mistake to only budget for the mortgage payment. That number is truly just the tip of the expense iceberg.
Ignoring the full spectrum of costs will sink your investment before it ever has a chance to turn a profit. To build a budget that's both accurate and resilient, you need to think about your expenses in three distinct categories.
This infographic breaks down exactly what you need to account for.
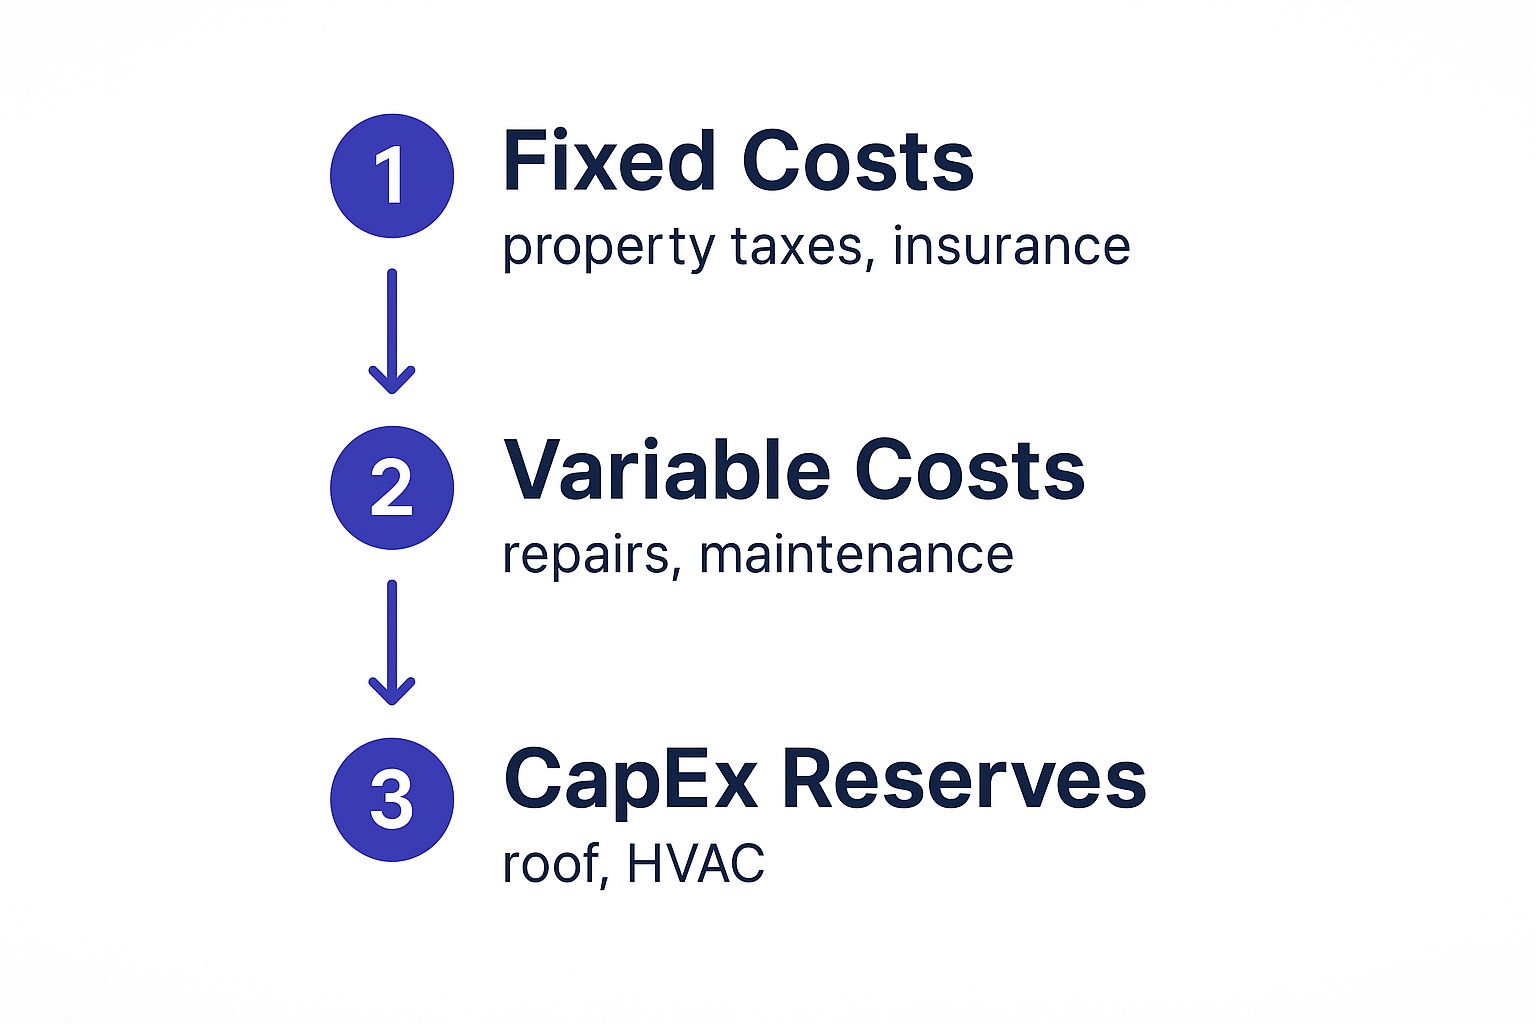
As you can see, a complete analysis moves from the predictable, fixed costs to the ones that fluctuate, and finally, to planning for those big-ticket items down the road.
Fixed and Variable Operating Expenses
First, let's dig into your day-to-day operating costs. These are the expenses required to keep the property running smoothly, and they fall into two main buckets:
- Fixed Expenses: These costs are consistent and predictable, making them pretty easy to budget for. Think property taxes, homeowners insurance, and any HOA or condo fees.
- Variable Expenses: These are the costs that bounce around from month to month based on usage or just plain bad luck. This category covers everything from repairs and routine maintenance to property management fees (typically 8-12% of monthly rent) and any utilities that you, as the landlord, are on the hook for.
A popular rule of thumb for quick, back-of-the-napkin math is the “50% Rule.” It suggests that all your operating expenses (everything except the mortgage) will average about 50% of your gross rental income over time. It's useful for a first glance at a property, but a serious analysis demands a lot more precision.
Let's look at a sample breakdown of what these operating expenses might look like for a typical single-family rental.
Example Monthly and Annual Expense Breakdown
The table below provides a sample breakdown of typical operating expenses for a single-family rental property, illustrating both monthly and annualized costs.
| Expense Category | Estimated Monthly Cost | Estimated Annual Cost | Notes |
|---|---|---|---|
| Property Taxes | $250 | $3,000 | Can be paid annually or semi-annually. |
| Homeowners Insurance | $100 | $1,200 | Varies by location, coverage, and property value. |
| HOA/Condo Fees | $50 | $600 | Applicable only if the property is in an HOA. |
| Property Management | $160 (8% of $2,000 rent) | $1,920 | Typically a percentage of gross monthly rent. |
| Repairs & Maintenance | $100 (5% of rent) | $1,200 | Budget for small fixes, pest control, etc. |
| Utilities (Landlord-paid) | $75 | $900 | e.g., water, sewer, trash, if not paid by tenant. |
| Vacancy Reserve | $100 (5% of rent) | $1,200 | Setting aside funds for when the property is empty. |
| TOTAL | $835 | $10,020 | This is the total operating expense before mortgage or CapEx. |
Remember, these are just estimates. Your actual costs will depend entirely on your specific property and market.
Planning for Capital Expenditures
The final—and most frequently forgotten—category is Capital Expenditures (CapEx). These aren't your minor repairs like a leaky faucet. We're talking about the major, big-ticket replacements that have a long lifespan but are absolutely inevitable.
Think of CapEx as the silent killers of cash flow. A new roof, HVAC system, or water heater can instantly wipe out years of profit if you haven't been setting money aside for them.
Accurately projecting these long-term expenses is crucial. This is where building up your reserve funds comes in. A common and wise practice is to budget between 5% and 10% of the gross rent each month specifically for future CapEx. It might feel like you're losing that cash flow now, but you'll be glad you did when that 15-year-old AC unit finally gives out in the middle of July.
Calculating Your Net Operating Income and Cash Flow
Okay, you've got your income and expenses mapped out. Now for the fun part: putting it all together. This is where the individual numbers transform into the two most important metrics in any real estate deal: your Net Operating Income and your final, bottom-line cash flow.
These two calculations are designed to cut through the noise. They give you a brutally honest look at how a property is actually performing financially.
Step 1: Find Your Net Operating Income
First up is your Net Operating Income (NOI). I like to think of NOI as the purest measure of a property's profitability. It shows you exactly how much money the asset generates on its own, completely separate from your personal financing choices, like the mortgage.
The formula couldn't be simpler:
Effective Gross Income (EGI) – Total Operating Expenses = Net Operating Income (NOI)
This number is the gold standard for comparing different investment opportunities. Why? Because it excludes debt service (your mortgage payment), you can use NOI to evaluate two completely different properties on an equal, apples-to-apples basis. It reveals which property is a more efficient money-making machine before financing ever enters the picture.
Your Net Operating Income reveals the raw earning power of the property itself. It's the profit generated from operations alone, making it an essential metric for any serious investor.
Step 2: Calculate Your True Cash Flow
Once you have your NOI, you're just one small step away from the number you’ve really been waiting for. To get to your true, spendable cash flow—the money that actually hits your bank account each month—you just subtract your total mortgage payment.
In investor speak, this mortgage payment is often called your debt service.
The final calculation looks like this:
Net Operating Income (NOI) – Total Mortgage Payment = Monthly Cash Flow
This final number is the ultimate test. Is it positive? Great, the property is paying for itself and then some. If it’s negative, that means you're reaching into your own pocket to cover a shortfall each month.
The demand for rentals has been on a tear, fueled in part by a massive global housing shortage. Research from Hines points to a shortfall of 6.5 million housing units in key developed economies just to meet current demand. This has pushed homeownership out of reach for many, fundamentally shifting the housing landscape. In fact, over 80% of households in these markets now live in countries where renting is becoming more common than buying.
Let's walk through a quick example to see these formulas in action:
| Calculation Step | Example Property Figure | Notes |
|---|---|---|
| Effective Gross Income | $2,375 | (Gross rent + other income) – vacancy loss |
| Total Operating Expenses | – $835 | Property taxes, insurance, management, repairs, etc. |
| Net Operating Income (NOI) | = $1,540 | This is the property's profit before the mortgage. |
| Total Mortgage Payment | – $1,350 | Principal and interest payment for the loan. |
| Monthly Cash Flow | = $190 | The final, spendable profit. |
Comparing Two Real World Property Scenarios

Okay, the theory and formulas are great, but the real magic happens when you plug in numbers from actual deals. That’s when a cash flow analysis stops being an abstract concept and starts telling you whether a property is a winner or a dud.
Let's run the numbers on two totally different investment opportunities. This will show you exactly how markets and property types can lead to wildly different outcomes. It’s a perfect illustration of why there’s no such thing as a "best" investment—only the one that actually fits your goals.
We’ll look at a pricey urban condo with high rent and even higher expenses, and then we'll compare it to a more modest single-family home in the suburbs.
Scenario A: The Urban Condo
First up is a sleek one-bedroom condo right in the heart of a buzzing downtown. It's a magnet for young professionals, so it commands a premium rent. But that prime location comes with a price—think hefty HOA fees, sky-high property taxes, and steep management costs.
Let's get into the nitty-gritty. The purchase price is a cool $400,000. We’re putting 20% down, which comes out to $80,000 in cash. The other $320,000 is financed over 30 years at a 6.5% interest rate.
Here’s what the monthly breakdown looks like:
- Gross Monthly Rent: $2,800
- Less 5% Vacancy: -$140
- Effective Gross Income (EGI): $2,660
- Total Operating Expenses: -$1,200 (This covers taxes, insurance, HOA, management, and repairs)
- Net Operating Income (NOI): $1,460
- Less Mortgage Payment: -$2,022
- Monthly Cash Flow: -$562
Whoa. Right out of the gate, this property is in the red with negative cash flow. Every single month, you'd have to pull $562 out of your own pocket just to keep it afloat. Sure, it might appreciate nicely over the long haul, but it's definitely not putting money in your bank account today.
Scenario B: The Suburban Single-Family Home
Next, let's head about 45 minutes outside the city to a quiet, secondary market. Here, we're looking at a three-bedroom single-family home perfect for a family that wants good schools and a bit more space.
The numbers are more approachable. The purchase price is $250,000, so our 20% down payment is a much more manageable $50,000. The $200,000 loan is at the same 6.5% rate over 30 years.
Let’s run that same cash flow analysis again:
- Gross Monthly Rent: $2,000
- Less 5% Vacancy: -$100
- Effective Gross Income (EGI): $1,900
- Total Operating Expenses: -$700 (Taxes, insurance, repairs, and management—no HOA here!)
- Net Operating Income (NOI): $1,200
- Less Mortgage Payment: -$1,264
- Monthly Cash Flow: -$64
This one is also slightly negative, but it’s a whole different ballgame. At just -$64 a month, it’s practically breaking even.
This comparison drives home a critical lesson for any investor: higher rent does not automatically equal better cash flow. Expenses, especially killers like HOA fees and city property taxes, can completely change the math on a deal.
The Final Verdict
Now for the fun part. Let's put these two scenarios head-to-head to see the full story. The table below lays out all the key metrics so you can get a crystal-clear snapshot of their financial performance.
Cash Flow Analysis Comparison: Urban vs. Secondary Market
| Metric | Property A (Urban Condo) | Property B (Suburban SFH) |
|---|---|---|
| Purchase Price | $400,000 | $250,000 |
| Down Payment (20%) | $80,000 | $50,000 |
| Gross Monthly Rent | $2,800 | $2,000 |
| Net Operating Income | $1,460 | $1,200 |
| Monthly Cash Flow | -$562 | -$64 |
When you see it all laid out, the choice becomes obvious for a cash flow investor. The urban condo demands $30,000 more in cash upfront but hemorrhages money every month. The suburban home, on the other hand, is much closer to being a self-sustaining asset.
If your primary goal is immediate income (or at least not losing money), the suburban house is the clear winner, even with its lower rent. This is the power of doing a proper cash flow analysis—it cuts through the noise and shows you what a property is truly worth to you.
Answering Your Lingering Questions About Rental Cash Flow
Even after the spreadsheets are closed and the scenarios are compared, a few key questions always seem to surface. Digging into a property’s cash flow can feel like a lot, but getting these final points ironed out will give you the confidence to make sharp, data-backed decisions.
Let’s tackle the questions that come up most often.
What’s a “Good” Cash Flow Number, Anyway?
This is the million-dollar question, and the only honest answer is: it all comes down to your goals.
If you’re an investor laser-focused on monthly income, anything less than $200 to $300 per door might not move the needle. You’re in it for immediate, reliable profit.
But what if you’re playing the long game in a hot market known for appreciation? In that case, breaking even or even carrying a small negative cash flow could be a brilliant move. You’re betting on the property's value soaring over the next decade. The "right" number is simply the one that fits your personal investment strategy.
A universally "good" cash flow doesn't really exist. The better question to ask is: "Does this property's cash flow support my personal financial objectives?" This shifts the focus from a generic benchmark to your unique investment plan.
How Do I Budget for Big-Ticket Repairs Like a New Roof?
This is where planning for Capital Expenditures (CapEx) becomes absolutely critical. You’ll never know the exact day your HVAC system decides to give up, but you can be 100% certain that day is coming. The only way to prepare is to sock away a percentage of your gross rental income every single month.
A smart, conservative approach is to reserve 5% to 10% of the gross rent specifically for these future expenses.
- For a property renting at $2,000/month: This means you’re putting $100 to $200 aside each month into a dedicated savings account.
- Over a full year: That builds up a reserve of $1,200 to $2,400.
By doing this consistently, a $10,000 roof replacement becomes a predictable business expense instead of a financial emergency that wipes out your personal savings. It’s how you turn chaos into control.
Should I Ever Touch a Negative Cash Flow Property?
It sounds completely backward, but sometimes the answer is a resounding yes. A property with negative cash flow isn't automatically a dud, but you need a very specific strategy—and the financial stability—to make it work.
Here are a few scenarios where it might make sense:
- Massive Appreciation Potential: The property is in a neighborhood that’s blowing up, and property values are projected to climb fast. The small monthly loss is a calculated trade-off for a huge equity payday down the road.
- Strategic Tax Benefits: For a high-income earner, the paper losses from depreciation and other deductions could offset taxes on other income, creating a net financial win even if the property itself loses a little each month.
- Clear Path to Rent Growth: You have solid data showing that local rents are poised for a significant jump. The property might be negative now, but your analysis shows it will turn positive within your planned holding period.
Make no mistake, buying a negative cash flow property is an advanced move. You should only even consider it if you have plenty of cash reserves to cover the monthly shortfall without breaking a sweat.
Ready to stop guessing and start analyzing with precision? The Chalet platform provides free, AI-driven tools to help you run a detailed rental property cash flow analysis on any property in the U.S. From estimating revenue to understanding local regulations, Chalet gives you the data you need to invest with confidence. Explore our free analytics and find your next investment today.


