
A short term rental investment calculator is the tool that separates successful investors from hopeful hobbyists. It lets you move beyond pure guesswork, plugging in real-world property details, financing terms, and operating costs to project critical financial metrics. Think cash flow, ROI, and cap rates—everything you need to turn a speculative idea into a predictable, profitable business.
Move Beyond Guesswork in Your STR Investments

Investing in a short-term rental (STR) based on emotion is one of the fastest ways to lose your shirt. It’s easy to fall in love with a charming cabin's mountain views or a beach condo's decor, but gut feelings don't pay the mortgage. This is where data-driven analysis becomes your most valuable asset.
The vacation rental market has matured, giving individual investors the same level of insight once reserved for large hospitality groups. Using a specialized short term rental investment calculator is no longer a "nice-to-have"—it's a fundamental step that prevents costly errors and uncovers hidden opportunities you'd otherwise miss.
Escaping Common Financial Traps
So many new investors fall into the same predictable traps. They get excited by a high gross revenue estimate from a platform like Airbnb but completely fail to account for the true costs of running the business.
A classic mistake is underestimating cleaning and turnover expenses, which can easily eat up 10-15% of your revenue and wipe out your projected profits. Another pitfall is overpaying for a property based on its looks rather than its cash-generating potential. An investor in Breckenridge might buy a stunning, fully updated home that's a 25-minute drive from the ski slopes, only to find that guests consistently book less flashy but more convenient properties, crushing their occupancy rates.
The Power of Precise Calculation
A robust calculator forces you to confront the numbers objectively. It makes you research and input realistic figures for every single variable, from property taxes and insurance to utility costs and supplies. For anyone serious about this, understanding the basics of building financial models in Excel is a fantastic starting point, as it forms the logical core of any reliable calculator.
By swapping gut feelings for hard data, you can model different scenarios and see how your investment holds up. For a deeper dive into the specific metrics and methods, it's worth exploring the various short-term rental analysis tools and techniques available to modern investors. This data-first approach shifts your mindset from simply buying a property to operating a predictable business.
"There's a significant difference between a vacation home and an investment property. You're buying a financial asset, not a personal memory. The best property isn't always the one that gives you the warmest feelings—it's the one with the strongest numbers."
To illustrate just how different these two approaches are, let's break it down.
Guesswork vs. Data-Driven Decisions
| Investment Aspect | Guesswork Approach | Calculator-Driven Approach |
|---|---|---|
| Revenue Projection | "This area is popular, so it should make a lot of money." | Uses real comps and market data to forecast ADR, occupancy, and seasonality. |
| Expense Budgeting | "I'll just set aside a few hundred a month for costs." | Itemizes all expenses: management, cleaning, utilities, taxes, insurance, and CapEx. |
| Financing Analysis | "My bank approved the loan, so it must be a good deal." | Models mortgage payments, interest rates, and down payments to calculate true cash flow. |
| Risk Assessment | Ignores potential downturns or regulatory changes. | Runs sensitivity analysis for lower occupancy or higher costs to stress-test the deal. |
| Final Decision | Based on emotion, aesthetics, and a "good feeling." | Based on concrete metrics like cash-on-cash return, cap rate, and NOI. |
Ultimately, a calculator provides the clarity needed to invest with confidence. The U.S. short-term rental market is projected to generate over $21 billion in annual revenue by 2028, and the investors who capture their share of that pie will be the ones who did their homework.
Gathering Key Data for Accurate Projections
A short-term rental investment calculator is a powerful tool, but its output is only as good as the numbers you feed it. The old saying "garbage in, garbage out" has never been more true. If you want a projection you can actually bank on, you need to dig for realistic, defensible numbers for every single input.
This is the real due diligence that separates successful investors from those who get blindsided by unexpected costs. Sure, things like the purchase price and loan details are easy enough to plug in. But the operational data? That’s where you’ll find the true profit potential—or lack thereof.
Sourcing Your Revenue Assumptions
Your revenue really boils down to two key metrics: your Average Daily Rate (ADR) and your Occupancy Rate. Getting these right is non-negotiable.
-
Average Daily Rate (ADR): This is the average you earn for every night a guest stays. Don't just take the seller's word for it or pull a number out of thin air. Instead, turn to data platforms that pull real booking information from thousands of properties. You can find a goldmine of information with dedicated Airbnb analytics, which show you what comparable properties in the area are actually earning.
-
Occupancy Rate: This is the percentage of available nights your property is actually booked. Seasonality is a huge factor here. A ski condo in Breckenridge might hit 85% occupancy in February but drop to 30% during the "mud season" in May. Your calculator needs a realistic annual average, not just the peak season fantasy.
Here’s a snapshot of the kind of market data you can pull from rental performance platforms.
This kind of chart gives you a bird's-eye view of a market's ADR and occupancy trends, which are the building blocks of a solid revenue forecast.
Uncovering the Hidden Operating Expenses
Gross revenue looks great on paper, but Net Operating Income (NOI) is what actually hits your bank account. Too many first-time investors dramatically underestimate their expenses, which leads to a world of cash flow pain. Your calculator needs to account for everything.
Start with the big, recurring costs:
- Property Management Fees: Planning to self-manage? Great, but your time isn't free. At the very least, assign a cost to it. Professional management will run you 20-30% of gross revenue. If you're going the DIY route, a conservative placeholder of 8-10% is a smart move to cover the tools and hours you'll inevitably put in.
- Insurance: Your standard homeowner's policy won't cut it. You need specialized STR or landlord insurance, and it can cost a whole lot more. The only way to know for sure is to get actual quotes.
- Lodging and Sales Taxes: These vary wildly by state, county, and even city. While guests pay them, you're the one responsible for remitting them, which directly impacts your cash flow. You have to research the exact rates for your property’s location.
- Utilities: Don't just use your own home's bills as a benchmark. Guests tend to be less conservative with the thermostat and lights. If you can, get estimates from local utility companies or ask the current owner for past bills.
Beyond these big-ticket items are the smaller, variable costs that add up faster than you'd think.
A classic rookie mistake is forgetting to budget for the endless cycle of restocking. Coffee, paper towels, soap, shampoo, and linens aren't one-time buys. They're a recurring operational cost that can easily run you hundreds of dollars every single month.
To get a handle on all these moving parts, it's worth exploring some of the best property management apps, as many are designed to help you track these very expenses.
Finally, don't forget about cleaning fees. Even if you pass the full cost to the guest, you still need to account for cleaning during vacancies for maintenance or times you might absorb the cost. A complete and honest expense list is the foundation of an accurate projection and, ultimately, a profitable investment.
Interpreting the Results: What the Numbers Mean
You’ve done the hard work of gathering your data and plugging it all into a short-term rental investment calculator. Now comes the fun part: making sense of the dashboard of financial metrics staring back at you. This output is where a list of projections and expenses transforms into actionable insight, giving you the clarity to make a confident, data-backed decision.
Your analysis starts with the top-line figures, which paint a broad picture of the property's earning potential. This process of gathering and visualizing data is fundamental to making sound decisions.
This visual flow shows how property specifics, income potential, and detailed expenses combine to create a full financial picture.
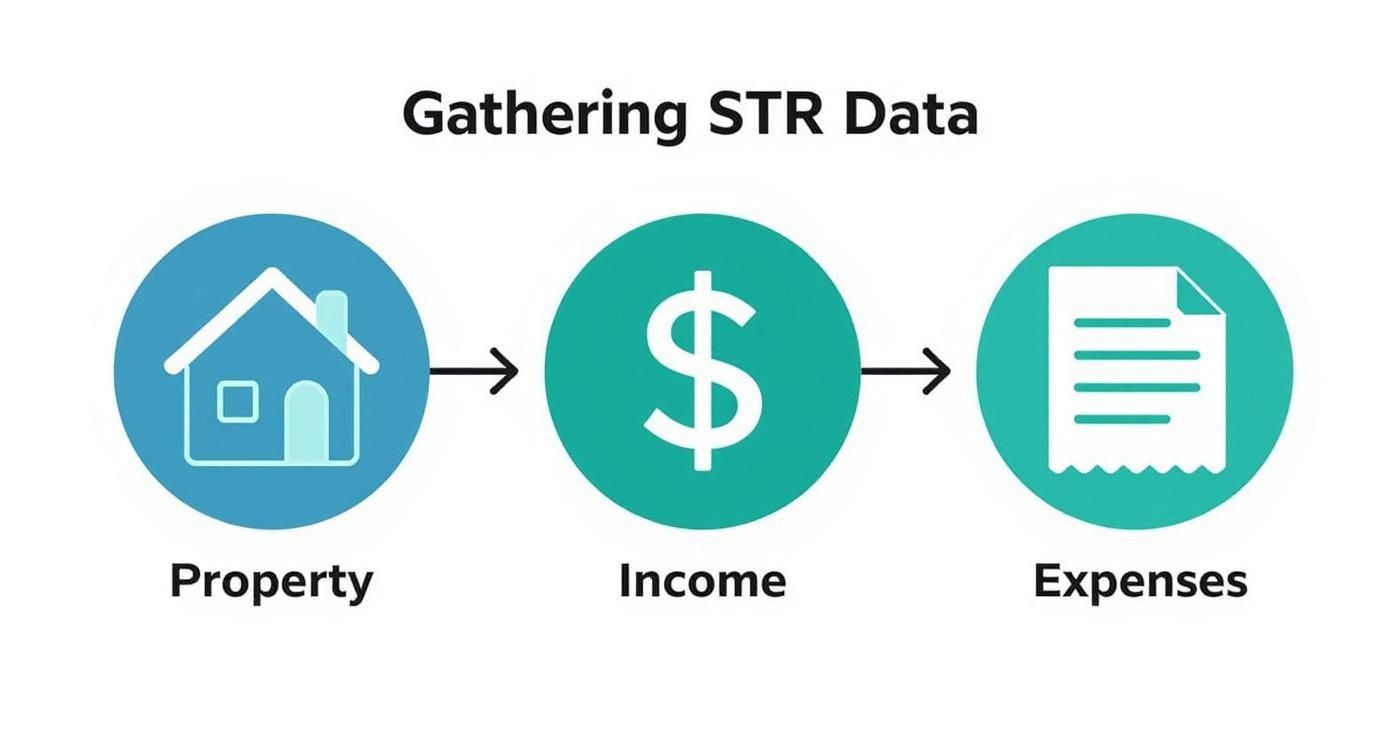
Ultimately, the infographic highlights that a reliable calculation depends on a complete and accurate assessment of all three core components.
From Gross Revenue to Net Operating Income
The first number you'll likely see is Gross Annual Revenue. This is the exciting, big number—the total of all your bookings over a year before a single expense is deducted. While it’s certainly motivating, it’s a vanity metric on its own.
Your focus should immediately shift to the Net Operating Income (NOI). This is your gross revenue minus all operating expenses before factoring in your mortgage. NOI is the true measure of a property's profitability as a standalone business, independent of your financing choices. A strong NOI tells you that you have a healthy, efficient operation on your hands.
The final piece of this puzzle is your Annual Cash Flow. This is what’s left after you’ve paid everything, including your mortgage principal and interest. It’s the money that actually lands in your bank account at the end of the year—your true profit. A positive cash flow means the property is self-sustaining and paying you; a negative one means you're feeding it money each month.
Understanding Your Return on Investment
With the core profit metrics defined, it's time to evaluate how hard your money is working for you. This is where return metrics like Cap Rate and Cash-on-Cash Return come into play. They help you compare different investment opportunities on an even playing field.
Capitalization (Cap) Rate
The Cap Rate is calculated by dividing your NOI by the property's purchase price. Think of it as the return you would get if you bought the property with all cash.
Cap Rate = Net Operating Income / Property Purchase Price
This metric is powerful because it allows for a direct, apples-to-apples comparison between different properties, regardless of how they’re financed. For example, a property with a 7% cap rate is generally a stronger performer than one with a 4% cap rate, assuming they are in similar markets.
The accuracy of these calculators has improved dramatically with the integration of localized data. For instance, Mashvisor.com’s calculator analyzes properties across hundreds of U.S. markets, providing deep insights. They report that average cap rates for short-term rentals can range from 5% to 8%, with some markets like Spring Hill, Florida, offering a 5% cap rate even with a median home price of $389,000.
Cash-on-Cash Return
While Cap Rate is excellent for comparison, Cash-on-Cash (CoC) Return is arguably more important for you as an investor. It measures the return on the actual cash you invested out-of-pocket (your down payment, closing costs, and initial setup expenses).
CoC Return = Annual Cash Flow / Total Cash Invested
This metric tells you precisely how efficient your invested capital is. If you invest $100,000 and your annual cash flow is $12,000, your CoC return is a healthy 12%. This is a critical indicator of your investment's performance, as it directly relates to the money you personally contributed.
Many investors aim for a CoC return of 10% or higher, but this can vary based on market appreciation potential and your personal financial goals. It's important to remember that these tools are powerful but not infallible; be sure to read about the pitfalls of relying on online short-term rental calculators to understand their limitations.
To help you keep these key metrics straight, here's a quick-reference table.
Key STR Investment Metrics Explained
| Metric | What It Measures | Why It Matters |
|---|---|---|
| Gross Annual Revenue | The total income generated from bookings before any expenses. | A top-line indicator of earning potential, but not a measure of profitability. |
| Net Operating Income (NOI) | Gross revenue minus all operating expenses (excluding mortgage). | Shows the property's profitability as a business, independent of financing. |
| Annual Cash Flow | The money left after all expenses, including the mortgage, are paid. | The actual profit that ends up in your pocket. This is your "take-home pay." |
| Cap Rate | The ratio of NOI to the property's purchase price. | Perfect for an apples-to-apples comparison of different properties' profitability. |
| Cash-on-Cash (CoC) Return | The ratio of annual cash flow to the total cash you invested. | The most personal metric; it tells you how hard your money is working for you. |
Understanding these numbers is what separates a guess from a calculated investment. They provide the language to evaluate, compare, and ultimately choose a property that aligns with your financial goals.
Planning for Long-Term Profitability and Risk
Month-to-month cash flow is exciting, but any seasoned investor will tell you that real profitability is a long game. The best short-term rental investment calculators push you beyond immediate returns, helping you map out long-term financial health and account for risks you haven't even thought of yet.
Two of the most critical parts of this forward-thinking analysis are budgeting for Capital Expenditures (CapEx) and running a sensitivity analysis. Skipping these steps is how a seemingly great deal can quietly turn into a money pit.
Accounting for Capital Expenditures
CapEx isn't your everyday operating cost like utilities or cleaning fees. These are the big, infrequent expenses needed to maintain or upgrade a property—the major investments that keep your rental competitive and functional over the years.
We're talking about the heavy hitters:
- Replacing a roof ($8,000 – $20,000+)
- A new HVAC system ($7,000 – $15,000)
- Updating major appliances
- Refreshing all the furniture every 5-7 years
Ignoring CapEx is a rookie mistake, and a costly one. A quality calculator forces you to confront this by having a dedicated field for it. The standard rule of thumb is to set aside 5-10% of your gross annual revenue for these inevitable costs. For a property pulling in $80,000 a year, that's $4,000 to $8,000 annually tucked away.
Ignoring CapEx is like driving a car without ever saving for new tires. For a while, everything seems fine. Then, suddenly, you're hit with a massive, unavoidable bill that could have been easily managed with consistent planning.
This proactive saving means that when a major system finally gives out, you have a dedicated fund ready to go. You won't have to wipe out your cash flow or take on debt to handle it. Plus, smart planning can even offer some financial upside; our guide on short-term rental tax deduction strategies dives into how some of these capital improvements can be leveraged.
Stress-Testing Your Investment with Sensitivity Analysis
So, what happens if the market softens? What if a new hotel opens down the street and your occupancy drops by 15%? A sensitivity analysis is how you answer these "what-if" questions. It's about stress-testing your financial model to see just how resilient your investment is to the inevitable shifts in the market.
By tweaking key variables in your calculator, you can see where the breaking points are and truly understand your risk exposure before you put any money down.
Modeling Different Scenarios
A proper sensitivity analysis isn't a one-and-done calculation. You need to model at least three distinct scenarios to get a full picture. This approach moves your analysis from a single, hopeful guess to a realistic spectrum of possibilities.
1. The Most-Likely Scenario: This is your baseline. It uses the realistic ADR, occupancy, and expense figures you've already spent time researching. Think of this as your expected performance if things go according to plan.
2. The Worst-Case Scenario: Now, let's model a downturn. Drop your projected occupancy by 20% and slice your ADR by 15%. Does the property still cash flow, or is it suddenly bleeding money every month? This is how you find your margin of safety.
3. The Best-Case Scenario: This is your optimistic outlook. Maybe a local attraction is expanding, or you're planning a renovation that could justify a 10% ADR bump. This model reveals the upside potential and helps you decide if certain strategic improvements are worth the investment.
Running these different models gives you a much deeper, more honest understanding of an investment's risk profile. A property that only works in a best-case scenario is a gamble. But one that stays afloat even in a downturn? That's a robust, secure investment. This level of analysis is what separates a calculated business decision from a shot in the dark.
Even the most buttoned-up projection from a short term rental investment calculator can fall apart the moment it hits the real world. Your numbers might look incredible on paper, but they’re meaningless if you’ve missed a critical operational flaw or a legal barrier. Honestly, avoiding these common mistakes is just as vital as running the initial analysis.
https://www.youtube.com/embed/wdFolZOQoQk
One of the most common blunders is running with wildly optimistic revenue figures. It’s so tempting to plug in peak-season occupancy and holiday ADRs, but that creates a financial model built on a house of cards. Seasonality is a huge factor in vacation markets. A ski condo in Breckenridge might be booked solid in January but see bookings completely dry up during the spring "mud season."
A realistic calculator forces you to average out those peaks and valleys to get a true annual picture. Ignoring this is the fastest way to find yourself in a cash flow crisis when bookings inevitably slow down.
Navigating Local Laws and Community Rules
Beyond flawed assumptions, the single biggest threat to a new STR investment is getting tripped up by regulations. You could find the perfect property with stellar numbers, only to learn you can't legally operate it as a short-term rental. This is a catastrophic—and completely avoidable—mistake.
Your due diligence has to include a deep dive into:
- Municipal Ordinances: Does the city or county have specific licensing rules, occupancy limits, or zoning restrictions for STRs? A lot of towns are cracking down and limiting new permits.
- HOA Restrictions: Homeowners' Associations are notorious for strict rules. Some ban STRs outright, while others impose minimum rental periods (like 30 days) that make a vacation rental business model impossible.
- Zoning Laws: Make sure the property is zoned for transient or commercial lodging. A "residential-only" zoning designation will stop your plans cold.
The worst call an agent can get is from a client who just closed on their "dream" STR, only to be slapped with a cease-and-desist letter from the city or HOA a week later. Don't assume—verify everything in writing before you close.
The good news is that online tools have made this kind of preliminary analysis easier than ever. Short-term rental investment calculators give individual investors a chance to compete by running sophisticated numbers. Platforms often provide free, interactive calculators that spit out instant revenue projections, but they can't do your local homework for you. You can see how some of these tools account for market-level trends by checking out valuable resources on short-term rental calculators.
The Perils of Deferred Maintenance
Another trap is underestimating the true condition of the property. A seller might give you their utility bills, but they won’t hand you a report detailing the 15-year-old HVAC system that's on its last legs or the roof that needs replacing in two years. These aren't minor operational expenses; they are major capital expenditures (CapEx) that can wipe out years of profit if you haven't budgeted for them.
Here’s a fantastic example from The Short Term Shop's calculator that shows separate fields for both routine repairs and major capital expenditures.
This screenshot perfectly illustrates why you need to separate day-to-day maintenance from big-ticket, long-term costs to get an accurate financial forecast. A thorough home inspection and a dedicated line item in your calculator for CapEx are non-negotiable. They are your best defense against these kinds of expensive surprises.
Common Questions About STR Calculators
Even the best tools spark questions. A short-term rental investment calculator is meant to bring clarity, but sometimes the numbers themselves make you think even harder. Here are some of the most common questions I hear from investors, with straight answers to help you analyze properties with confidence.
Think of this as the final gut-check before you dive in, making sure you understand the why behind the numbers, not just the what.
How Accurate Are These Calculators, Really?
The accuracy of any calculator comes down to two things: the quality of its data and the quality of your inputs.
The revenue side can be surprisingly on-point, especially if the tool is pulling real-time, local market data from a source like AirDNA, which tracks actual performance from thousands of properties.
But the expense side? That’s all on you. To get a truly accurate picture, you have to do the legwork. Get actual quotes for STR insurance. Look up the property’s specific tax records online. Call the local utility companies and ask for historical usage data.
A good STR calculator is a powerful framework, not a magic eight ball. Its accuracy is a partnership: it provides the aggregated market data, but you have to supply the diligent, property-specific research.
What’s a Good Cash-on-Cash Return for an STR?
While "good" always depends on your personal goals, the general consensus in the STR community is that you should aim for a cash-on-cash (CoC) return of 10% or higher. Many seasoned investors I know won't even look twice at a deal that projects below that. A CoC return over 15% is fantastic.
But context is everything. A property in a booming mountain town with high appreciation potential might justify a slightly lower CoC, since you’re banking on long-term equity growth.
Always ask yourself: is this return worth the effort? Compare it to what your cash could earn in a hands-off investment like an S&P 500 index fund. If the STR doesn't significantly outperform it, you have to question if the work of running it is really worth your time.
Can I Use a Calculator for Rental Arbitrage?
Absolutely. A solid short-term rental calculator is the perfect tool for stress-testing a rental arbitrage deal. The financial logic is the same, but the inputs are a little different.
Your main operating expense isn't a mortgage—it's your monthly long-term lease payment. And your "down payment" is your startup capital, which should include:
- Security deposit
- First month's rent
- The total cost to furnish and stock the property
Plug those numbers in, and the calculator will show you your projected cash flow and, most importantly, your cash-on-cash return on that initial investment. It’s the best way to know if an arbitrage venture is a smart move before you sign a lease.
How Much Should I Actually Budget for Repairs and CapEx?
This is where so many new investors get burned. They project amazing cash flow but forget to set aside money for the big-ticket items that eventually fail.
A reliable rule of thumb is to budget 5-10% of your gross annual rental income for both routine maintenance and long-term Capital Expenditures (CapEx).
Let's make that real. If your property is projected to bring in $60,000 in gross revenue, you need to be saving $3,000 to $6,000 a year for these costs. That means putting $250 to $500 into a separate savings account every single month.
Stick to the low end (5%) for newer or recently flipped homes where the major systems have plenty of life left. But for an older property with a 15-year-old roof or an aging HVAC system? You absolutely need to lean toward the higher end (10%). This fund ensures that when something big breaks, it’s a planned expense—not an emergency that kills your profits.
Ready to turn your analysis into action? At Chalet, we provide the tools, data, and expert connections you need to invest in short-term rentals with confidence. Explore our free analytics, browse vetted STR properties for sale, and connect with specialized agents in your target market. Start your journey at https://www.getchalet.com.