
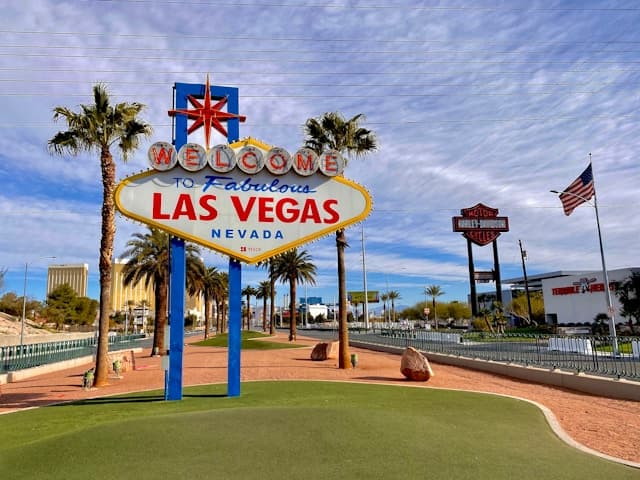
According to Chalet Data, Las Vegas remains a magnet for short-term rental investors, but the best yields are no longer confined to the Strip. In 2026, the city’s top-performing neighborhoods cluster in west and central Las Vegas, where gross yields run from 7.2% up to 11.4%.
Entry prices span a wide range, with the median home value across this ranked set stretching from $336,525 in Winchester to $461,216 in Buffalo. Despite a 24% drop in citywide occupancy year-over-year, Las Vegas still sits at the 42nd percentile for gross yield among major US markets, with median occupancy at 44% and a $229 ADR.
The story in 2026 is one of shifting momentum. Home values have softened 3.3% over the past year, while ADRs have surged 28%. The neighborhoods at the top of this list balance resilient demand with moderate price points, and several see occupancy peaks well above the city median. Investors who understand the seasonality and guest mix in each area can still find outsized returns.
Las Vegas Short-Term Rental Market at a Glance
- Median gross yield: 8.3%
- Annual revenue (headline, all listings): $35,334
- Active-operator annual revenue: $33,974
- Median occupancy rate: 44%
- Average daily rate: $229
- Median home value (Zillow ZHVI): $425,749 (YoY -3.3%)
- Active full-time listings: 7,935
- US gross-yield rank: #271
- Data period: 2025-07 to 2026-06
The Best Las Vegas Neighborhoods for Airbnb, Ranked by Yield
| Rank | Neighborhood | Gross Yield | Annual Revenue | Median Home Value | ADR | Occupancy | Active Listings |
|---|---|---|---|---|---|---|---|
| 1 | Twin Lakes | 11.4% | $40,746 | $358,660 | $109 | 62% | 33 |
| 2 | Buffalo | 10.5% | $48,201 | $461,216 | $272 | 48% | 76 |
| 3 | Spring Valley | 10.2% | $42,842 | $418,865 | $222 | 39% | 1,217 |
| 4 | Rancho Charleston | 9.1% | $34,512 | $380,345 | $190 | 47% | 158 |
| 5 | Paradise | 8.9% | $34,954 | $394,381 | $227 | 44% | 2,643 |
| 6 | Michael Way | 8.4% | $30,225 | $357,794 | $177 | 43% | 67 |
| 7 | The Strip | 8.1% | $36,904 | $453,559 | $241 | 53% | 1,704 |
| 8 | Sunrise Manor | 8.1% | $28,978 | $358,768 | $133 | 39% | 202 |
| 9 | Winchester | 7.3% | $24,551 | $336,525 | $132 | 37% | 113 |
| 10 | Centennial Hills | 7.2% | $32,170 | $448,555 | $138 | 46% | 39 |
Data as of July 11, 2026. Annual revenue is calculated for each listing as ADR × occupancy × 365, using trailing 12-month data (2025-07 to 2026-06), and reflects gross earnings before expenses. The table reports the median listing’s revenue, ADR, and occupancy, which are calculated independently.
Gross yield divides the median annual revenue by the median home value (Zillow ZHVI). See our full methodology. The active-operator revenue benchmark filters for listings with sustained booking activity and is the best underwriting proxy for buyers considering a committed rental strategy.
1. Twin Lakes: High Occupancy, Accessible Price Point
In 2026, Twin Lakes stands out for its combination of yield and occupancy. The neighborhood leads Las Vegas with an 11.4% gross yield, well above the city’s 8.3% median, and its 62% occupancy rate is among the highest in the metro. November brings a dramatic occupancy peak at 80%, while June drops to just 17%, highlighting a sharply seasonal pattern that investors must plan for. Winter, fall, and spring each contribute 27% of annual revenue, with summer trailing at 19%.
Home values here have dipped 2.8% year-over-year to $358,660, keeping entry costs moderate. The typical listing earns $40,746 annually, with active operators pulling in $38,386. Payback on the median purchase is just 9.3 years at active-operator revenue, a standout for Las Vegas. The area’s steady demand is anchored by a mix of single-family homes and proximity to central Las Vegas employers. For those seeking more context on Twin Lakes’ performance and property mix, the analytics dashboard offers a deeper dive.
| Gross yield | 11.4% |
| Annual revenue | $40,746 |
| Active-operator revenue | $38,386 |
| Occupancy | 62% |
| ADR | $109 |
| Median home value (YoY) | $358,660 (-2.8%) |
| Full-time listings | 33 |
Who this market is ideal for: Buyers seeking high occupancy and a relatively quick payback in a stable, centrally located neighborhood.
2. Buffalo: High Revenue, Premium ADR
Revenue surges in Buffalo, where the median listing brings in $48,201 annually and gross yield sits at 10.5%, comfortably in the 65th percentile among 501 US markets. Occupancy fluctuates with the seasons, peaking at 61% in July before dropping to 36% in May, while the average daily rate jumps to $272, well above the national and Las Vegas medians.
This pronounced seasonality, with winter and spring each contributing 31% of annual revenue, reflects the area’s appeal for both holiday and spring travelers, yet also exposes owners to softer spring demand.
The payback period, just under 10 years based on active-operator revenue of $47,752, is competitive given Buffalo’s higher median home value of $461,216 (down 2.6% year-over-year). That figure is supported by the strong performance of larger homes. Four-bedroom properties can earn over $52,000 per year at a $489 ADR, which helps offset the market’s recent 30% drop in occupancy and 23% decline in listings.
The sharp 157% year-over-year increase in ADR signals a shift toward premium pricing, likely as operators adjust to tighter supply and changing guest preferences for upscale, group-friendly accommodations near both suburban amenities and the Strip. See the full Buffalo breakdown for more on property type performance.
| Gross yield | 10.5% |
| Annual revenue | $48,201 |
| Active-operator revenue | $47,752 |
| Occupancy | 48% |
| ADR | $272 |
| Median home value (YoY) | $461,216 (-2.6%) |
| Full-time listings | 76 |
Who this market is ideal for: Investors seeking higher nightly rates and strong group demand in a suburban setting.
3. Spring Valley: Volume and Versatility
Price-driven investors will note Spring Valley’s median gross yield of 10.2%, placing it in the 64th percentile among 501 US markets and ahead of the national median. Occupancy peaks at 50% in July, reflecting robust summer travel, but dips to 31% in June, highlighting the area’s pronounced seasonal swings. Fall stands out as the top revenue season, accounting for 27% of annual income, while the remaining quarters each contribute 24%, signaling relatively balanced off-peak demand.
Active full-time operators in Spring Valley manage 1,217 listings, indicating significant liquidity and a healthy competitive environment. The payback period of 10.2 years for active operators is favorable compared to many urban peers, aided by a diverse bedroom mix that ranges from budget-friendly one-bedrooms (523 listings) to lucrative five-bedroom homes.
This variety helps the market absorb shifts in guest preferences and adapt to evolving demand, while proximity to the Strip and major employers continues to drive bookings even as occupancy has softened by 30% year-over-year and listings have contracted by 20%. For a full breakdown of bedroom mix and seasonal swings, check the Spring Valley analytics.
| Gross yield | 10.2% |
| Annual revenue | $42,842 |
| Active-operator revenue | $41,069 |
| Occupancy | 39% |
| ADR | $222 |
| Median home value (YoY) | $418,865 (-4.6%) |
| Full-time listings | 1,217 |
Who this market is ideal for: Buyers looking for a large, liquid market with diverse property options and steady demand.
4. Rancho Charleston: Downtown Access, Balanced Returns
Price trends in Rancho Charleston reflect a shifting market, as median home values have slipped 3.1% year-over-year to $380,345, yet gross yields remain at 9.1%, placing this neighborhood just above the US median and in the 51st percentile of 501 markets.
Occupancy rates here track slightly higher than the national median at 47%, with summer demand peaking in July at 58% occupancy and an ADR of $158, before dropping sharply to a June low of 32%. This seasonality underscores the importance of timing for revenue optimization, since spring alone brings in 27% of annual revenue while summer and winter each contribute around a quarter.
Active-operator revenue closely matches the headline figure at $33,612, and with 158 full-time listings, the area supports a healthy pool of experienced hosts. Investors can expect roughly 11.3 years to recoup their purchase price at current gross revenue levels, a payback period that signals moderate risk in a market with manageable entry costs.
The mix of older and mid-century housing stock ties directly to demand, as guests are drawn to proximity to downtown and the Arts District, while the variety in bedroom configurations allows for targeting both short city breaks and longer family stays. For more on property types and tiered earnings, see the Rancho Charleston analytics page.
| Gross yield | 9.1% |
| Annual revenue | $34,512 |
| Active-operator revenue | $33,612 |
| Occupancy | 47% |
| ADR | $190 |
| Median home value (YoY) | $380,345 (-3.1%) |
| Full-time listings | 158 |
Who this market is ideal for: Investors focused on downtown access and a balanced risk-return profile.
5. Paradise: Central Location, Consistent Demand
Pricing trends in Paradise reflect a market with steady but slightly softening demand, as seen in the 7% year-over-year drop in June occupancy despite a notable 17% rise in ADR for the same month.
Occupancy rates reach their high point in March at 50% (ADR $234), then drop to a June low of just 36%, highlighting the impact of seasonal travel patterns tied to conventions, university events, and vacation schedules. Revenue is well-distributed throughout the year, with winter leading at 27% and other seasons each contributing about a quarter of annual earnings, which helps smooth out cash flow for operators.
Paradise sits at the 49th percentile for gross yield among 501 US markets, with its 8.9% yield and $34,954 annual revenue nearly matching national medians. The market’s 2,643 active full-time listings indicate a highly competitive landscape, yet the payback period of 11.7 years remains attractive for buyers seeking central, reliable returns.
The prevalence of one-bedroom properties, 1,373 listings earning $15,216 per year, caters to solo travelers and couples, while investors willing to purchase larger homes can capture up to $54,036 annually. Proximity to the Strip, UNLV, and the airport drives this consistent demand, ensuring Paradise remains a stronghold for both leisure and business stays. For a full breakdown of Paradise’s performance and trends, visit the Paradise analytics dashboard.
| Gross yield | 8.9% |
| Annual revenue | $34,954 |
| Active-operator revenue | $33,705 |
| Occupancy | 44% |
| ADR | $227 |
| Median home value (YoY) | $394,381 (-3.2%) |
| Full-time listings | 2,643 |
Who this market is ideal for: Buyers seeking steady demand and central Las Vegas access for both short and mid-term stays.
6. Michael Way: Affordable Entry, Spring Surge
Price-conscious buyers find Michael Way attractive, with its median home value of $357,794 registering a 3.5% annual decline and positioning the area below the US median price point. The 8.4% gross yield lands at the 44th percentile among 501 US markets, with occupancy slightly trailing the national median at 43%.
Spring stands out as the clear revenue driver here, accounting for 29% of annual income and featuring a March occupancy peak of 58% (ADR $172), while June drops to 37% occupancy as demand softens with the arrival of summer.
Momentum data from the past year reveals a complex picture. While the average daily rate climbed 22% in June 2026 compared to the prior year, occupancy slid 12%, and active listings shrank by 7%. This suggests that, despite fewer hosts and rising nightly prices, overall demand has eased, perhaps due to broader market cooling or shifting traveler preferences.
Investors should note the 12.3-year payback period, which reflects both moderate active-operator revenue ($28,984) and the neighborhood’s dominance of smaller homes, particularly one-bedrooms, which are plentiful but earn far less than three-bedroom properties. For a closer look at how different property types perform in Michael Way, review the analytics dashboard.
| Gross yield | 8.4% |
| Annual revenue | $30,225 |
| Active-operator revenue | $28,984 |
| Occupancy | 43% |
| ADR | $177 |
| Median home value (YoY) | $357,794 (-3.5%) |
| Full-time listings | 67 |
Who this market is ideal for: Investors prioritizing affordability and a market with a strong spring booking window.
7. The Strip: High Occupancy, Price Momentum
Pricing power defines The Strip, where the average daily rate of $241 edges out the US median and occupancy consistently outperforms at 53%, ranking above the national median of 45%.
August stands out as the strongest month for bookings with a 57% occupancy peak, while June’s sharp drop to 30% reflects the region’s pronounced summer slowdown. Despite this volatility, revenue remains balanced across seasons, with both winter and fall contributing 26% each to annual totals and spring and summer close behind at 24% apiece.
Operators here face a payback period of roughly 12.7 years, a figure that reflects the area’s high home values, now up 8.1% year-over-year to $453,559, relative to revenue potential. The Strip’s dominant one-bedroom inventory (over 1,000 listings) attracts steady leisure demand, but three-bedroom properties, while less common, command the highest annual earnings at $38,525 and a premium $322 ADR.
Momentum has recently shifted. June 2026 saw occupancy drop 27% year-over-year even as ADR jumped 33%, signaling softening demand amid rising prices. This interplay of high operator count, robust pricing, and shifting occupancy shapes a market best suited to buyers prepared for cyclical swings and focused on both nightly rate strategy and long-term appreciation. For a full breakdown of The Strip’s performance, visit the Strip analytics dashboard.
| Gross yield | 8.1% |
| Annual revenue | $36,904 |
| Active-operator revenue | $35,578 |
| Occupancy | 53% |
| ADR | $241 |
| Median home value (YoY) | $453,559 (+8.1%) |
| Full-time listings | 1,704 |
Who this market is ideal for: Buyers seeking high occupancy and ADR in the heart of Las Vegas tourism, with an eye on price appreciation.
8. Sunrise Manor: Steady Value, Modest Returns
Market fundamentals in Sunrise Manor reflect a middle-of-the-pack performer among US short-term rental markets, with its 8.1% gross yield landing in the 39th percentile and occupancy rates trailing the national median by six points.
The area sees its highest occupancy in October at 50%, while April marks a notable low at just 30%, pointing to pronounced off-peak softness that owners must factor into their projections. Despite this, revenue remains remarkably balanced across all four seasons, with each quarter contributing roughly 25% of the annual total, a stability that helps smooth out cash flow over the year.
Active full-time operators here average $27,756 in annual revenue, and the typical 12.9-year payback period means investors should expect a moderate timeline to recoup their upfront costs. The dominance of affordable, smaller homes, especially one-bedrooms, which make up the majority of listings, caters to budget-conscious and longer-stay guests, but also limits the upside on nightly rates.
Recent momentum data shows a 15% drop in occupancy and a 22% decline in listings, even as ADR has jumped 30% year-over-year, suggesting that while supply is tightening and prices are rising, demand has softened. This dynamic, combined with a 2.1% dip in home values, underscores the importance of conservative underwriting and a focus on value-driven segments in Sunrise Manor’s evolving landscape. For more details on Sunrise Manor’s performance, see the Sunrise Manor analytics dashboard.
| Gross yield | 8.1% |
| Annual revenue | $28,978 |
| Active-operator revenue | $27,756 |
| Occupancy | 39% |
| ADR | $133 |
| Median home value (YoY) | $358,768 (-2.1%) |
| Full-time listings | 202 |
Who this market is ideal for: Value-focused buyers looking for stable returns in an affordable, east-side neighborhood.
9. Winchester: Budget Entry, Slower Bookings
Lower prices set Winchester apart, with its $336,525 median home value representing the most affordable entry among the Las Vegas submarkets tracked. This affordability comes with tradeoffs.
The 7.3% gross yield places Winchester in just the 33rd percentile nationally, well below the US median of 9.0%, and the median occupancy rate of 37% trails the US median of 45%. Occupancy shows dramatic swings, reaching 52% in August but plunging to just 19% in June, reflecting a market that struggles to maintain consistent demand outside peak periods.
Revenue patterns reveal why underwriting here requires caution. The payback period stretches to 14.1 years, meaning investors face a longer wait to recoup their purchase price compared to most US markets. One-bedroom units dominate the landscape, making up more than half of full-time listings, yet they generate the lowest annual revenue ($11,107) and ADR ($81), while three-bedroom properties, though less common, command much higher income ($25,702 at $251 ADR).
Softening demand is evident. Occupancy has fallen 53% year-over-year even as ADR climbed 15%, and listings dropped 12%, signaling stiffer competition for bookings. For more on how property type and seasonality affect returns, visit the Winchester analytics page.
| Gross yield | 7.3% |
| Annual revenue | $24,551 |
| Active-operator revenue | $23,848 |
| Occupancy | 37% |
| ADR | $132 |
| Median home value (YoY) | $336,525 (-2.3%) |
| Full-time listings | 113 |
Who this market is ideal for: Buyers seeking the lowest entry price and willing to work with slower seasonality and lower occupancy.
10. Centennial Hills: Higher Price, Balanced Occupancy
Price-sensitive investors will note Centennial Hills sits at the 31st percentile for gross yield among US markets, with its 7.2% return trailing the national median of 9.0%. The average daily rate of $138 is well below the US median of $232, but occupancy holds steady at 46%, just above the national midpoint.
March is the high season, when occupancy surges to 74% even as ADR remains affordable at $135, while November marks the slowest period with occupancy falling to 30%, a swing that shapes revenue timing and operational planning.
Recent momentum suggests softening demand, as occupancy has dropped 36% year-over-year despite a 29% rise in ADR and a 12% reduction in active listings. The typical property here is a one-bedroom, with 28 out of 39 full-time listings in this category, earning $18,207 per year at a $100 nightly rate.
With a payback period of nearly 15 years, investors should factor in the neighborhood’s moderate pace of returns and its reliance on seasonal peaks, especially fall (28% of annual revenue) and winter (27%), to balance risk and forecast cash flow. For a deeper dive into these dynamics, the analytics dashboard offers a full breakdown.
| Gross yield | 7.2% |
| Annual revenue | $32,170 |
| Active-operator revenue | $30,159 |
| Occupancy | 46% |
| ADR | $138 |
| Median home value (YoY) | $448,555 (-3.1%) |
| Full-time listings | 39 |
Who this market is ideal for: Investors seeking a quieter, higher-priced neighborhood with balanced occupancy and moderate returns.
How to read these rankings before you buy
Gross yield is a useful first filter, showing the ratio of annual rental revenue to property price, but it is only a starting point. The headline revenue figures in these rankings average all listings, including those with sporadic bookings.
For a truer sense of what a committed operator can achieve, look to the active-operator revenue, which filters for listings with sustained activity. Even so, neighborhood-level stats mask the wide range of performance between properties. Seasonality, property type, and management quality can all shift returns significantly.
Before buying, always underwrite at the property level. Compare bedroom counts, review seasonal occupancy swings, and factor in local regulations and taxes. Use these rankings to narrow your search, but never skip due diligence on the specific address.
How to Act on This
Las Vegas offers a spectrum of short-term rental opportunities, but success depends on matching your investment strategy to the neighborhood’s guest profile and seasonality. Properties near the Strip and downtown see higher occupancy and ADR, but entry prices and regulatory scrutiny can be steeper. Outlying neighborhoods like Twin Lakes and Michael Way provide more affordable entry and quicker payback, but may require a hands-on approach to marketing and guest experience.
Regulation is a moving target in Las Vegas. The city requires a short-term rental permit, and owners must comply with local ordinances, including business licensing and conditional use verification. The city’s official portal provides up-to-date requirements, and a state lodging tax applies to all transient rentals.
As of 2026, the property tax rate is 0.50%, and the state lodging tax for Clark County is at least 2% of gross receipts. Always verify the latest rules before closing, as proximity restrictions and permit caps may apply depending on the jurisdiction.
To navigate the market and regulations with confidence, work with a local agent who specializes in short-term rental investment. Find your Las Vegas STR agent to get tailored guidance and property-level analysis.