


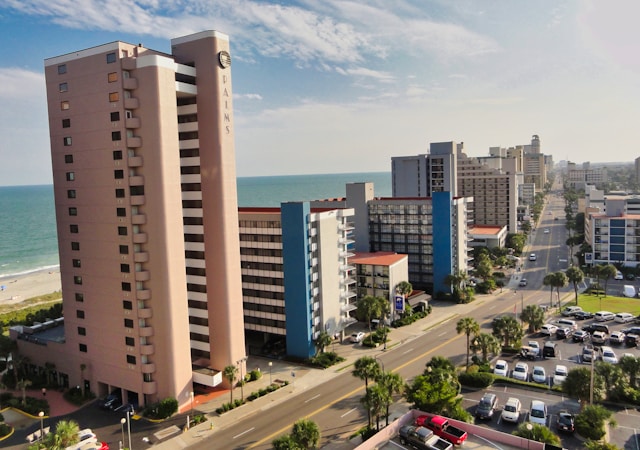
According to Chalet Data, Myrtle Beach remains a magnet for short-term rental investors, but the 2026 numbers show a sharper divide between the oceanfront core and the city’s inland neighborhoods. Gross yields in the top five areas run from 12% down to 7%, with entry prices spanning from just over $263,000 to $341,000. The city as a whole now sits in the 76th percentile for US yield, outpacing most coastal competitors.
Recent supply contraction, active listings are down 28%, has combined with a 25% jump in occupancy and a 17% rise in ADR to push revenues higher, especially in the most tourist-driven pockets. The result is a market where the best returns cluster near the beach, but family-focused and golf-oriented enclaves still offer stable, if lower, yields.
Investors who move quickly can still capture strong payback periods, but underwriting must account for pronounced seasonality and a cooling home value trend.
Myrtle Beach Short-Term Rental Market at a Glance
- Median gross yield: 12.0%
- Annual revenue (headline): $38,700
- Active-operator annual revenue: $36,700
- Median occupancy rate: 42%
- Average daily rate (ADR): $197
- Median home value: $323,000 (YoY -2.5%)
- Active full-time listings: 6,686
- US gross-yield rank: #114
- Data period is July 2025 – June 2026
The Best Myrtle Beach Neighborhoods for Airbnb, Ranked by Yield
| Rank | Neighborhood | Gross Yield | Annual Revenue | Median Home Value | ADR | Occupancy | Active Listings |
|---|---|---|---|---|---|---|---|
| 1 | Myrtle Beach Boardwalk & Downtown Core | 12% | $38,700 | $323,000 | $197 | 42% | 6,686 |
| 2 | Surfside Beach | 10% | $33,400 | $333,000 | $187 | 49% | 1,204 |
| 3 | Arcadian Shores & Coastal Resorts | 10% | $31,500 | $319,000 | $209 | 41% | 1,087 |
| 4 | Socastee | 7% | $22,500 | $308,000 | $169 | 37% | 1,011 |
| 5 | Carolina Forest | 7% | $23,700 | $341,000 | $181 | 36% | 1,045 |
Data as of July 11, 2026. Each listing’s annual revenue is calculated from its own ADR × occupancy × 365 on trailing 12-month data, gross before expenses. The table shows the median listing’s revenue, ADR, and occupancy, which are computed independently and will not multiply to the revenue figure.
Gross yield divides the median revenue by the median home value (Zillow Home Value Index). See our full methodology. The active-operator revenue benchmark filters for listings with real, sustained booking activity and is the most reliable underwriting guide for buyers.
1. Myrtle Beach Boardwalk & Downtown Core: Peak Yield in the Heart of the Action
The numbers at the core of Myrtle Beach are hard to ignore. This neighborhood leads the city with a 12% gross yield and a median annual revenue of $38,700, both well above US medians. The Boardwalk area’s 6,686 full-time listings reflect the sheer scale of demand, especially in summer when occupancy surges to 82% in July and ADR peaks at $245.
Seasonality is pronounced, January occupancy drops to just 12%, and winter only accounts for 16% of annual revenue. But the market’s overall momentum is strong. Occupancy is up 25% year-over-year, and ADR has climbed 17%, driven by a supply squeeze as listings have fallen sharply. The median home value sits at $323,000, down 2.5% from last year, which shortens the payback period to under nine years on active-operator revenue.
Most properties here are condos and small multifamily units, appealing to buyers who want steady tourist traffic and the flexibility to target both short summer stays and shoulder-season events. For a closer look at bedroom mix and revenue by property type, the analytics dashboard for this area breaks down the details.
| Gross yield | 12% |
| Annual revenue | $38,700 |
| Active-operator revenue | $36,700 |
| Occupancy | 42% |
| ADR | $197 |
| Median home value (YoY) | $323,000 (-2.5%) |
| Full-time listings | 6,686 |
Who this market is ideal for: Buyers seeking maximum yield and reliable summer demand in Myrtle Beach’s most established rental zone.
2. Surfside Beach: Family Appeal and Strong Shoulder Seasons
Surfside Beach, just south of the city core, stands out for its family-friendly atmosphere and a gross yield of 10%. Median annual revenue lands at $33,400, powered by a notably high occupancy rate of 49%, seven points above the city median. Summer is still king, with July occupancy at 86%, but spring and fall together contribute half the year’s revenue, softening the off-season dip.
Home values here average $333,000, and the active-operator revenue of $32,900 supports a payback period just above ten years. The most common properties are single-family homes and duplexes, catering to multi-generational groups and longer stays. Surfside’s steady bookings reflect its reputation as the “Family Beach,” and the area’s 1,204 active listings keep competition manageable.
If you want to compare ADR and occupancy trends by property size, the Surfside Beach analytics page has the full breakdown.
| Gross yield | 10% |
| Annual revenue | $33,400 |
| Active-operator revenue | $32,900 |
| Occupancy | 49% |
| ADR | $187 |
| Median home value (YoY) | $333,000 (-2.5%) |
| Full-time listings | 1,204 |
Who this market is ideal for: Investors prioritizing high occupancy and family-oriented demand just outside the busiest tourist core.
3. Arcadian Shores & Coastal Resorts: Upscale Stays and Resort Premiums
Arcadian Shores and its neighboring resort corridor deliver a 10% gross yield on a median home value of $319,000. Annual revenue for the median listing is $31,500, and ADR rises to $209, well above the city average. The area’s 1,087 full-time listings skew toward higher-end condos and oceanfront resort units, drawing guests willing to pay a premium for amenities and proximity to golf courses and Barefoot Landing.
Occupancy here matches the city median at 41%, with a strong July peak (80%) and a steeper winter trough (13%). Spring and fall shoulder seasons combine for 48% of annual revenue, making this a market where the calendar can be managed for consistent cash flow. The active-operator benchmark shows $30,700 in annual revenue, supporting a payback period just over ten years.
For those interested in how luxury property types perform, the Arcadian Shores analytics dashboard details revenue by bedroom count and property style.
| Gross yield | 10% |
| Annual revenue | $31,500 |
| Active-operator revenue | $30,700 |
| Occupancy | 41% |
| ADR | $209 |
| Median home value (YoY) | $319,000 (-2.5%) |
| Full-time listings | 1,087 |
Who this market is ideal for: Buyers targeting higher nightly rates and resort-driven demand, with a focus on amenities and ocean views.
4. Socastee: Inland Value and Suburban Growth
Socastee offers a different profile from the city’s coastal zones. Gross yield here is 7%, with annual revenue of $22,500 and a lower median home value of $308,000. Occupancy averages 37%, dipping to 10% in January but reaching 74% in July, showing that summer still drives most bookings.
The area’s 1,011 full-time listings are primarily single-family homes and townhouses, appealing to guests who want more space and quieter surroundings. Spring and fall together account for 50% of annual revenue, so investors can expect more balanced seasonality than in the beachfront core. Active-operator revenue comes in at $21,900, and the payback period stretches toward fourteen years, so buyers should underwrite conservatively.
Socastee’s appeal lies in affordable entry points and proximity to nature parks and southern Myrtle Beach attractions. For a property-type breakdown and further yield analysis, see the Socastee analytics page.
| Gross yield | 7% |
| Annual revenue | $22,500 |
| Active-operator revenue | $21,900 |
| Occupancy | 37% |
| ADR | $169 |
| Median home value (YoY) | $308,000 (-2.5%) |
| Full-time listings | 1,011 |
Who this market is ideal for: Value-focused buyers seeking lower price points and steady demand from families and groups.
5. Carolina Forest: Golf, Green Space, and Steady Returns
Carolina Forest rounds out the list with a 7% gross yield and $23,700 in median annual revenue. Home values are the highest among the top five at $341,000, reflecting the area’s planned-community appeal and proximity to golf courses. Occupancy is 36%, with a summer peak at 70% and a softer winter trough (11%).
This neighborhood’s 1,045 full-time listings are dominated by single-family homes and townhomes, drawing guests who want suburban amenities and easy access to both the beach and golf. Active-operator revenue is $23,100, and the payback period is just under fifteen years, so buyers should be patient and focus on long-term appreciation potential.
For more insight into how Carolina Forest’s property mix compares to the rest of Myrtle Beach, the Carolina Forest analytics dashboard details yield and revenue by bedroom count.
| Gross yield | 7% |
| Annual revenue | $23,700 |
| Active-operator revenue | $23,100 |
| Occupancy | 36% |
| ADR | $181 |
| Median home value (YoY) | $341,000 (-2.5%) |
| Full-time listings | 1,045 |
Who this market is ideal for: Buyers with a long-term outlook who want a blend of suburban comfort and consistent, if moderate, returns.
How to read these rankings before you buy
Gross yield is a useful first filter for short-term rental markets, but it’s only part of the story. The headline annual revenue in each neighborhood reflects all listings, including those with minimal activity, while the active-operator benchmark focuses on properties with sustained bookings, this is the figure buyers should use for underwriting.
Median occupancy and ADR are reported independently, so multiplying them will not reproduce the revenue number. Yield does not account for expenses, taxes, or financing costs, and seasonality can swing returns sharply month to month. Always verify the numbers at the property level and consider how your own operations might outperform or underperform the median.
How to Act on This
Buying a short-term rental in Myrtle Beach means weighing seasonality, property type, and guest demand drivers unique to each neighborhood. The highest yields cluster near the Boardwalk and oceanfront, but these areas also see the most competition and the sharpest winter slowdowns.
Family-oriented and golf-focused neighborhoods like Surfside Beach and Carolina Forest offer steadier bookings across the year, but with lower overall returns. Entry prices vary widely, so set your budget and target a payback period that matches your risk tolerance.
Regulation is an evolving landscape in Myrtle Beach. No primary city source currently defines permit or license requirements, so it’s essential to verify current rules with local authorities before closing. South Carolina does levy a state accommodations tax, and hosts must comply with local lodging tax collection and remittance.
Work with a local agent who understands both the regulatory environment and the nuances of each neighborhood’s guest demand. Get matched with a Myrtle Beach short-term rental agent to start your search with expert guidance.