


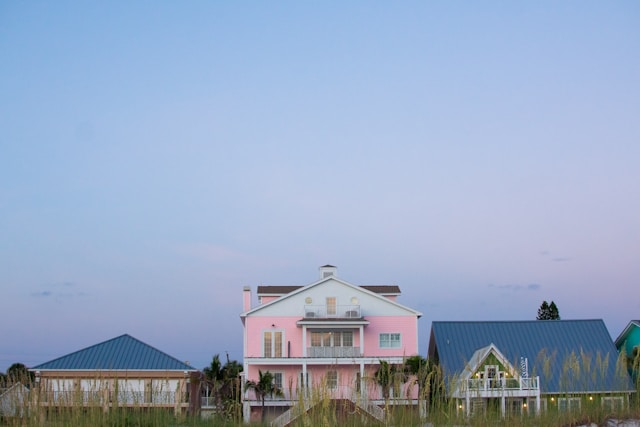
According to Chalet Data, clearwater’s short-term rental market draws investors with its powerful tourist appeal and above-average returns, though the strongest yields concentrate in just a handful of neighborhoods. For 2026, the top three areas deliver yields ranging from 7.4% to 6.4%, and annual revenue potential varies widely, from $54,100 in Clearwater Beach Association to $21,600 in East Gateway. Entry prices reflect this divide. The beach commands a median of $729,200, while inland neighborhoods cluster near $340,000.
Across the city, Clearwater posts a 13.9% median gross yield, ranking in the 86th percentile nationally. Occupancy rates outstrip the US median by eight points. Over the past year, rising occupancy and climbing ADRs have kept the market’s momentum steady, even as home values edged down. For buyers, these trends underscore the city’s sharp seasonality and the need for disciplined underwriting.
Clearwater Short-Term Rental Market at a Glance
- Median gross yield: 13.9%
- Annual revenue (headline): $47,839
- Active-operator annual revenue: $46,291
- Median occupancy rate: 53%
- Average daily rate (ADR): $224
- Median home value: $343,374 (YoY -6.1%)
- Active full-time listings: 1,454
- US gross-yield rank: #65
- Data period is July 2025 – June 2026
The Best Clearwater Neighborhoods for Airbnb, Ranked by Yield
| Rank | Neighborhood | Gross Yield | Annual Revenue | Median Home Value | ADR | Occupancy | Active Listings |
|---|---|---|---|---|---|---|---|
| 1 | Clearwater Beach Association | 7.4% | $54,093 | $729,203 | $252 | 57% | 547 |
| 2 | Spring Branch Neighborhood Park Association | 7.0% | $23,759 | $340,190 | $137 | 60% | 43 |
| 3 | East Gateway Business And Neighbors Association | 6.4% | $21,642 | $340,190 | $107 | 52% | 31 |
Source note: Data as of July 11, 2026. Each neighborhood’s annual revenue is calculated from its own ADR × occupancy × 365, using trailing 12-month data and reporting the median listing’s revenue before expenses. Median ADR and occupancy are computed independently.
Multiplying them will not reproduce the revenue figure. Gross yield divides the median revenue by the median home value (Zillow Home Value Index). See methodology for details. The active-operator benchmark filters to listings with sustained booking activity and is the key underwriting metric for committed buyers.
1. Clearwater Beach Association: High Revenue, High Entry Price
Clearwater Beach Association claims the top spot for short-term rental revenue, buoyed by its iconic beachfront and a steady stream of visitors year-round. Median annual revenue reaches $54,100, the highest in the city, supported by a 57% occupancy rate and a strong $252 ADR. March stands out, with occupancy hitting 74% and ADRs peaking at $315. Spring alone generates 29% of annual revenue. December is slower, with occupancy dipping to 43%, though nightly rates remain firm for holiday travelers.
Home values here are steep. The median sits at $729,200, more than double the citywide figure, leaving gross yield at 7.4% and placing the neighborhood in the 33rd percentile nationwide.
The payback period runs about 14.1 years at the active-operator revenue benchmark, requiring buyers to take a longer-term view. Most properties are 1-bedroom condos, but the top earners are 4-bedroom homes, grossing nearly $68,000 annually at premium rates.
Tourism anchors Clearwater Beach’s performance. Active listings jumped 53% over the past year, while occupancy nudged up only 1%. For a granular breakdown of property types and seasonality, the analytics page for Clearwater Beach Association covers every metric in detail.
| Gross yield | 7.4% |
| Annual revenue | $54,093 |
| Active-operator revenue | $51,874 |
| Occupancy | 57% |
| ADR | $252 |
| Median home value (YoY) | $729,203 (-8.6%) |
| Full-time listings | 547 |
Who this market is ideal for: Buyers looking for maximum revenue in a flagship, tourism-driven neighborhood, and prepared for a longer payback period.
2. Spring Branch Neighborhood Park Association: Strong Occupancy, Accessible Pricing
Spring Branch Neighborhood Park Association presents a distinct profile, pairing accessible home prices with the city’s highest occupancy rate at 60%. The median home value sits at $340,200, close to the Clearwater average, while annual revenue reaches $23,800.
March brings the busiest stretch, with occupancy peaking at 78%, four points higher than any other area in the city. Winter as a whole delivers 28% of yearly revenue. November is the slowest month, with occupancy dropping to 35%, highlighting this neighborhood’s sensitivity to seasonal shifts.
Gross yield stands at 7.0%, in the 28th percentile nationally, and the payback period is roughly 14.5 years for active operators. The ADR trails the city median at $137, though steady bookings and lower acquisition costs balance the equation. Over the past year, occupancy slipped 9% and listings contracted by the same margin, yet ADRs climbed 21%.
This neighborhood appeals to buyers who want stable occupancy and attainable entry prices. For those weighing the trade-offs between nightly rates and booking frequency, the Spring Branch analytics page provides a full breakdown of revenue and property types.
| Gross yield | 7.0% |
| Annual revenue | $23,759 |
| Active-operator revenue | $23,416 |
| Occupancy | 60% |
| ADR | $137 |
| Median home value (YoY) | $340,190 (-4.9%) |
| Full-time listings | 43 |
Who this market is ideal for: Investors seeking a combination of affordability and high occupancy, with moderate revenue in a residential setting.
3. East Gateway Business And Neighbors Association: Supply Squeeze, Budget Entry
East Gateway Business And Neighbors Association completes the list, matching Spring Branch for the lowest median home value at $340,200. Annual revenue clocks in at $21,600, and gross yield is 6.4%, putting this area in the 21st percentile nationwide. Occupancy holds at 52%, with a modest ADR of $107, making this the most budget-friendly option for both buyers and guests.
Seasonality shows a different pattern here. Occupancy hits its high in June at 76%, while December bottoms out at 33%. Summer contributes 28% of annual revenue, reversing the spring-centric trend seen elsewhere in Clearwater.
In the past year, occupancy surged 59% even as ADR declined 5% and listings dropped 18%. This tightening supply and growing demand for value-focused stays shapes the neighborhood’s outlook. The payback period is the longest of the three at 16.6 years, so buyers should focus on active-operator performance and property condition when underwriting.
For investors tracking upward occupancy and a shrinking supply, the East Gateway analytics dashboard highlights the trends at the entry level.
| Gross yield | 6.4% |
| Annual revenue | $21,642 |
| Active-operator revenue | $20,454 |
| Occupancy | 52% |
| ADR | $107 |
| Median home value (YoY) | $340,190 (-4.9%) |
| Full-time listings | 31 |
Who this market is ideal for: Buyers focused on low entry costs and a market where occupancy is rising against a backdrop of limited supply.
How to read these rankings before you buy
Gross yield offers a fast way to compare neighborhoods, but it’s only a starting point. Each table’s headline revenue shows what the median listing earns before expenses. The active-operator figure highlights properties with sustained bookings, serving as the more realistic baseline for underwriting.
Seasonality shapes returns in Clearwater, with spring and summer providing most of the annual revenue. Multiplying ADR by occupancy will not match the revenue number, since each is calculated independently. Always check property-level details. Factors like exact location, property condition, and amenities can swing results beyond what the median suggests.
How to Act on This
Buying a short-term rental in Clearwater involves weighing entry price, seasonality, and payback horizon. Beachfront neighborhoods bring the highest revenue but demand greater upfront investment and a longer wait to recoup costs. Inland areas offer lower prices and steadier occupancy, though returns are more modest.
Regulation remains fluid. No primary city source is available, so confirm local rules and licensing requirements before proceeding. Florida’s state lodging tax and Pinellas County’s tourist development tax both apply, and these should be part of your pro forma.
Clearwater’s market rewards careful underwriting and local expertise. If you’re ready to move forward, match with a Clearwater short-term rental agent who can guide you through neighborhood specifics, property selection, and compliance. In a city shaped by seasonality and price point, the right advice can make the difference between average and standout returns.