


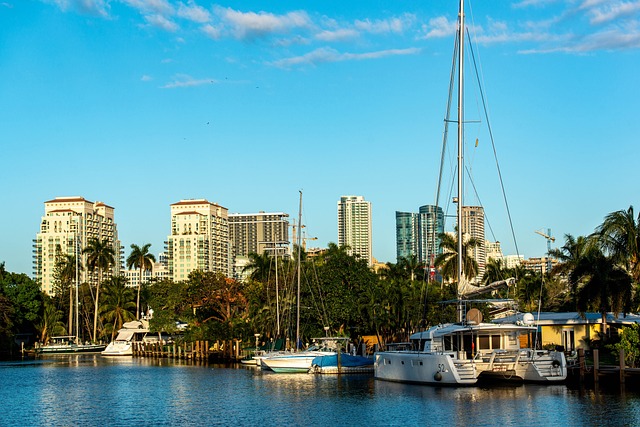
According to Chalet Data, Fort Lauderdale’s short-term rental market is a study in contrasts, with yields clustering highest in neighborhoods west and north of downtown where home values have softened but guest demand remains robust. Across the city, gross yields span from 8.8% to a striking 19.8%, and entry prices range from the low $300Ks to over $1M. The city’s median yield of 10.2% sits well above the US median, and occupancy has surged 12% year-over-year while inventory has tightened.
This supply squeeze, paired with a 42% jump in ADR, is reshaping the landscape. High-performing pockets reward buyers who can move quickly and underwrite for active-operator returns. If you’re eyeing Fort Lauderdale, the best bets are in neighborhoods where occupancy peaks early in the year and winter still drives a third or more of annual revenue.
Fort Lauderdale Short-Term Rental Market at a Glance
- Median gross yield: 10.2%
- Annual revenue (headline): $52,300
- Active-operator annual revenue: $51,100
- Median occupancy rate: 59%
- Average daily rate (ADR): $236
- Median home value: $511,700 (YoY -5.4%)
- Active full-time listings: 3,576
- US gross-yield rank: #170
- Data period is July 2025 – June 2026
The Best Fort Lauderdale Neighborhoods for Airbnb, Ranked by Yield
| Rank | Neighborhood | Gross Yield | Annual Revenue | Median Home Value | ADR | Occupancy | Active Listings |
|---|---|---|---|---|---|---|---|
| 1 | Imia | 19.8% | $81,700 | $412,600 | $366 | 65% | 30 |
| 2 | Cpca | 17.0% | $98,400 | $579,500 | $227 | 55% | 43 |
| 3 | Hdca | 13.9% | $46,800 | $336,600 | $179 | 59% | 49 |
| 4 | Central Corals | 12.8% | $76,200 | $594,700 | $296 | 63% | 38 |
| 5 | Ewca | 11.7% | $57,200 | $488,300 | $199 | 66% | 38 |
| 6 | North Andrews Gardens | 11.5% | $46,200 | $403,100 | $257 | 59% | 55 |
| 7 | Trca | 10.5% | $58,200 | $551,700 | $192 | 60% | 49 |
| 8 | Roca | 9.9% | $58,100 | $588,400 | $257 | 63% | 41 |
| 9 | Crai | 9.0% | $101,800 | $1,137,200 | $210 | 62% | 80 |
| 10 | Cbha | 8.8% | $49,300 | $561,800 | $277 | 52% | 431 |
Data as of July 11, 2026. Each listing’s annual revenue is calculated from its own ADR × occupancy × 365 on trailing 12-month data, gross before expenses. The table reports the median listing’s revenue, alongside median ADR and median occupancy computed independently, so multiplying the table’s ADR by its occupancy will not reproduce the revenue figure.
Gross yield divides the median revenue by the median home value (Zillow Home Value Index). See methodology. The active-operator revenue figure filters to listings with sustained booking activity and is the best benchmark for underwriting a committed purchase.
1. Imia: The City’s Highest Yield, Fueled by Winter Demand
Winter’s surge in Imia drives occupancy to 86% in February, with average daily rates spiking to $500, making this period the core of its annual performance. Spring follows closely, and together these seasons account for 62% of yearly revenue, while the September trough still maintains a resilient 50% occupancy.
This robust seasonality is a key reason Imia’s gross yield sits at the 96th percentile among 501 US markets, far surpassing the national median of 9.0% and outperforming the US median occupancy of 45%.
Recent momentum is shaped by a dramatic 42% drop in listings over the past year, creating a pronounced supply squeeze that has helped push occupancy up 29% and daily rates up 37%. The result for investors is a short payback horizon, just over five years at the active-operator revenue level, which is unusually fast for a coastal market.
With only 30 active full-time listings, underwriting here must account for tight inventory and competition, but the numbers reflect Imia’s enduring appeal for travelers seeking affordable, well-located homes near Fort Lauderdale’s waterways and beaches. For buyers, the Imia analytics page details the full seasonality and bedroom mix.
| Gross yield | 19.8% |
| Annual revenue | $81,700 |
| Active-operator revenue | $80,600 |
| Occupancy | 65% |
| ADR | $366 |
| Median home value (YoY) | $412,600 (-7.3%) |
| Full-time listings | 30 |
Who this market is ideal for: Buyers seeking rapid payback and strong winter-spring cash flow in a supply-constrained submarket.
2. Cpca: High Revenue, Big Swings in ADR
Sharp winter demand in Cpca sends February occupancy to 73% and pushes ADR to $376, a figure that towers over the $227 annual average. By May, occupancy drops to 50%, underscoring the area’s heavy reliance on winter travel and making seasonal pricing strategy crucial for operators. With winter accounting for 35% of annual revenue, properties here can outperform for owners who optimize for peak months, while spring and fall each contribute 22% and summer 21% to the annual mix.
Among 501 US markets, Cpca’s 17.0% gross yield lands it in the 94th percentile, far above the national median of 9.0%, and its 55% occupancy also outpaces the US median. The payback period of 6.1 years, based on robust active-operator revenue of $95,086, offers a compelling case for investors despite a 6.7% drop in home values.
The dominance of one-bedroom listings (26 out of 43) signals a market catering to couples or solo travelers, and the dramatic +98% year-over-year ADR jump paired with a 40% listing decline suggests that constrained supply has enabled aggressive rate growth even as occupancy softened slightly. Smart underwriting here means weighing rate volatility, as revenue hinges on capturing outsized winter demand and adapting quickly to shifts in supply. For more details, see the Cpca analytics page.
| Gross yield | 17.0% |
| Annual revenue | $98,400 |
| Active-operator revenue | $95,100 |
| Occupancy | 55% |
| ADR | $227 |
| Median home value (YoY) | $579,500 (-6.7%) |
| Full-time listings | 43 |
Who this market is ideal for: Investors focused on maximizing revenue during high-ADR months and comfortable with rate volatility.
3. Hdca: Entry-Level Pricing with Above-Average Returns
Pricing in Hdca sits well below the US median, making this market a compelling choice for investors prioritizing affordability without sacrificing yield. February’s occupancy peak at 76% and a winter revenue share of 41% confirm that cold-season demand drives performance, while even in the quieter June trough, occupancy holds at 54%.
Compared to the US field, Hdca’s 13.9% gross yield places it in the 86th percentile, and its 59% median occupancy outpaces the national median of 45%, showing broad appeal beyond just the high season.
Recent data highlight strong momentum. Occupancy has climbed 16% year-over-year and ADR surged 55%, even as listings declined by 20%, creating a classic supply squeeze that benefits existing operators. The most common property type is a 1-bedroom, with 27 such listings earning $26,430 per year at a $151 ADR, which provides a reference point for underwriting smaller units.
With a payback period of about 7.3 years on gross active-operator revenue, Hdca offers a relatively swift path to recouping investment, especially for those able to optimize for winter demand. For more on Hdca’s seasonal patterns, its analytics page details the monthly swings.
| Gross yield | 13.9% |
| Annual revenue | $46,800 |
| Active-operator revenue | $46,400 |
| Occupancy | 59% |
| ADR | $179 |
| Median home value (YoY) | $336,600 (-9.2%) |
| Full-time listings | 49 |
Who this market is ideal for: Buyers seeking affordability and solid winter-driven returns with manageable off-season dips.
4. Central Corals: High Occupancy, Premium Pricing
Price leadership defines Central Corals, with its $296 average daily rate sitting well above the US median and March’s ADR spiking to $389 during peak season. Occupancy here also impresses, reaching 87% in March and averaging 63% over the year, which outpaces the US median of 45%. This strong performance places Central Corals in the 80th percentile nationally for gross yield, making it a standout among 501 tracked US markets.
Winter and spring generate the bulk of annual revenue, 33% and 31% respectively, while fall lags at just 14%, underscoring the importance of capturing bookings during high-demand months. Recent data shows a dramatic supply squeeze. Listings fell 28% year-over-year, while occupancy jumped 28% and ADR surged 164%.
Fewer available homes have allowed active operators to command premium rates and maximize returns, with a payback period of just 7.9 years. Investors should note that the market’s high-end positioning and limited inventory have directly fueled both price growth and occupancy gains, favoring those who can underwrite for strong winter-spring performance. Central Corals’ analytics page is essential reading for anyone underwriting high-end short-term rentals here.
| Gross yield | 12.8% |
| Annual revenue | $76,200 |
| Active-operator revenue | $75,100 |
| Occupancy | 63% |
| ADR | $296 |
| Median home value (YoY) | $594,700 (-0.9%) |
| Full-time listings | 38 |
Who this market is ideal for: Operators targeting premium rates and high winter-spring occupancy in an upscale setting.
5. Ewca: Consistent Bookings, Strong Winter Peaks
Winter demand shapes Ewca’s performance, with March occupancy reaching 86% at an ADR of $200 and winter generating 32% of annual revenue. Even in the slower month of November, bookings remain solid at 50%, which helps stabilize cash flow and makes this market less volatile than many others. Ewca’s 66% median occupancy rate stands well above the US median of 45%, placing it in the 75th percentile for gross yield among 501 US markets.
Recent momentum is driven by a 22% year-over-year jump in both occupancy and ADR, alongside a 28% drop in listings, creating a supply squeeze that supports pricing power. The nearly identical annual revenue figures for headline and active-operator listings ($57,221 and $56,997, respectively) suggest most properties are managed effectively, minimizing underperformance risk for new entrants.
With an estimated payback of 8.6 years, Ewca offers a relatively swift path to recouping the median $488,326 home value, especially for investors seeking reliable winter and spring returns. The Ewca analytics dashboard highlights its resilience across the calendar.
| Gross yield | 11.7% |
| Annual revenue | $57,200 |
| Active-operator revenue | $57,000 |
| Occupancy | 66% |
| ADR | $199 |
| Median home value (YoY) | $488,300 (-4.3%) |
| Full-time listings | 38 |
Who this market is ideal for: Investors prioritizing high occupancy and steady winter-spring cash flow.
6. North Andrews Gardens: Family-Sized Homes, Steady Returns
Pricing power in North Andrews Gardens stands out, with its $257 average daily rate sitting above the US median and supporting a gross yield that ranks in the 73rd percentile nationwide.
March brings the highest occupancy at 82%, driven by seasonal demand from families and groups seeking larger homes, while September’s occupancy dips to 34% as travel slows and competition for bookings intensifies. These pronounced swings reflect the area’s appeal for winter and spring getaways, which together account for 63% of annual revenue.
Momentum in the past year has been shaped by a 25% jump in occupancy and a 31% rise in ADR, even as listings shrank by 38%, creating a supply squeeze that benefits active operators.
The dominant 3-bedroom segment, with 31 listings and a $288 ADR, caters directly to group travel, and the typical payback period of under nine years signals a relatively swift path to recouping investment compared to many US markets. For those underwriting deals, the combination of elevated seasonal rates, reduced competition, and strong group appeal underpins both the returns and the resilience of North Andrews Gardens as an STR investment choice. For more, see the North Andrews Gardens analytics page.
| Gross yield | 11.5% |
| Annual revenue | $46,200 |
| Active-operator revenue | $45,700 |
| Occupancy | 59% |
| ADR | $257 |
| Median home value (YoY) | $403,100 (-5.0%) |
| Full-time listings | 55 |
Who this market is ideal for: Buyers targeting larger homes and strong winter-spring occupancy for groups or families.
7. Trca: Balanced Returns, Spring Surge
Spring’s influence on Trca is unmistakable, with March occupancy soaring to 85% and average daily rates climbing to $235, highlighting the market’s peak earning window. September, by contrast, sees occupancy dip to just 39%, illustrating pronounced seasonality that investors must factor into cash flow planning. Over the past year, a sharp supply squeeze, listings down 33%, has combined with an 11% occupancy gain and a remarkable 82% jump in ADR, creating a competitive environment that rewards well-positioned hosts.
Trca’s gross yield of 10.5% ranks in the 67th percentile among 501 US markets, outpacing the US median of 9.0% and supported by occupancy rates 15 points above the national norm. Payback sits at roughly 9.7 years based on active-operator revenue, a sustainable horizon for those seeking steady returns in a mid-priced market.
The prevalence of 1-bedroom listings (27 out of 49) at a $137 ADR and $19,510 annual revenue signals both affordability and flexibility, making Trca a fit for investors aiming to capture demand from solo travelers and couples during high-traffic months. For more on Trca’s seasonal and bedroom mix, visit its analytics dashboard.
| Gross yield | 10.5% |
| Annual revenue | $58,200 |
| Active-operator revenue | $57,000 |
| Occupancy | 60% |
| ADR | $192 |
| Median home value (YoY) | $551,700 (-4.5%) |
| Full-time listings | 49 |
Who this market is ideal for: Investors looking for balanced returns and a strong spring booking window.
8. Roca: High Occupancy, Premium Price Point
Roca’s appeal rests on its strong winter and spring performance, with February occupancy reaching 76% and average daily rates surging to $348. These peak months drive nearly two-thirds of annual revenue, as winter and spring together account for 61% of the yearly total. The seasonal pattern reflects Roca’s popularity with snowbirds and families escaping colder regions, translating to robust demand and pricing power during prime travel periods.
Against the US field, Roca sits at the 61st percentile for gross yield and boasts an occupancy rate well above the national median. The payback period of just over ten years signals a balanced investment, especially given the sharp 41% drop in listings over the past year.
This supply squeeze, coupled with a remarkable 89% jump in ADR and 30% occupancy growth, has intensified competition for available inventory. The dominance of 2-bedroom listings (20 active, $33,893 annual revenue) offers a clear underwriting path for investors targeting mid-sized homes, as this segment aligns with the area’s core guest demand. For more, see the Roca analytics dashboard.
| Gross yield | 9.9% |
| Annual revenue | $58,100 |
| Active-operator revenue | $57,400 |
| Occupancy | 63% |
| ADR | $257 |
| Median home value (YoY) | $588,400 (-3.9%) |
| Full-time listings | 41 |
Who this market is ideal for: Buyers seeking high occupancy in a premium price band, especially for mid-sized homes.
9. Crai: Luxury Price, High Revenue, Middle-Yield
High-end buyers will find Crai’s $1.14M median home value paired with $101,805 in annual revenue, a combination that lands the area’s 9.0% gross yield exactly at the US median. Crai’s occupancy rate, however, stands out at 62%, far above the US median of 45%, and its $210 average daily rate sits just below the national figure.
March brings a pronounced surge, with occupancy peaking at 81% and ADR reaching $213, while October marks the seasonal low at 50% occupancy, reflecting the spring-heavy revenue mix (30% in spring, 29% in winter).
Momentum in the past year has been dramatic. Occupancy jumped 38%, ADR climbed 47%, and listings dropped by a third, creating a clear supply squeeze that supports both rates and revenue. The market’s 11.4-year payback period reflects the luxury pricing, but with 43 active 1-bedroom listings averaging $19,670 per year and $167 nightly, investors should underwrite carefully for scale and property type.
Crai’s numbers are driven by strong seasonal demand, limited new supply, and a product mix that appeals to travelers seeking upscale accommodations. For a full breakdown of Crai’s luxury segment, see the analytics dashboard.
| Gross yield | 9.0% |
| Annual revenue | $101,800 |
| Active-operator revenue | $99,700 |
| Occupancy | 62% |
| ADR | $210 |
| Median home value (YoY) | $1,137,200 (-0.4%) |
| Full-time listings | 80 |
Who this market is ideal for: Investors with capital to deploy in luxury homes who want high revenue and solid occupancy.
10. Cbha: Large Market, Softening Demand
Pricing strength defines Cbha, where the average daily rate of $277 stands more than $40 above the US median, even as occupancy has slipped to 52%.
The winter season delivers the lion’s share of returns, with February occupancy hitting 65% and winter overall contributing 38% of annual revenue, while a sharp drop to 37% occupancy in June underscores the market’s heavy seasonal skew. This pattern reflects Cbha’s appeal to snowbird travelers and short-term winter escapes, driving up ADRs during peak months and compressing demand in the off-season.
Recent momentum signals caution for investors. Occupancy slid 17% year-over-year and the active listing count shrank by nearly a quarter, yet ADR surged 52%, suggesting that operators are holding rate even as some demand slips away. Underwriting here requires attention to property type, as the most common listing, 1-bedrooms, earns just $24,504 per year, while 3-bedrooms command $60,948 and the highest ADR at $379.
With a payback period of 11.9 years, just shy of the US median, and a gross yield at the 48th percentile nationally, Cbha’s scale offers opportunity, but only for those prepared to actively manage pricing and adapt to shifting demand. For more on Cbha’s shifting demand, its analytics page tracks the latest trends.
| Gross yield | 8.8% |
| Annual revenue | $49,300 |
| Active-operator revenue | $47,400 |
| Occupancy | 52% |
| ADR | $277 |
| Median home value (YoY) | $561,800 (-7.2%) |
| Full-time listings | 431 |
Who this market is ideal for: Buyers seeking scale or diversification in a large, established submarket, with an eye on ADR management.
How to read these rankings before you buy
Gross yield is a powerful screening tool, showing the relationship between a neighborhood’s median revenue and its median purchase price. However, it does not account for expenses, management intensity, or regulatory risk. The headline revenue figure averages all listings, while the active-operator benchmark filters for properties with sustained bookings, this is the number to underwrite against if you plan to operate competitively.
Seasonality, property type, and guest demand can all shift returns dramatically even within the same block. Always verify at the property level and factor in your own operating costs and strategy before committing to a purchase.
How to Act on This
Fort Lauderdale’s short-term rental market is shaped by both opportunity and regulation. Before buying, confirm that your target property meets the city’s Vacation Rental Registration Program requirements, including state and local licensing, tax registration, and compliance with housing and safety standards (see Article X – Vacation Rentals, City of Fort Lauderdale). The property tax rate sits at 0.95%, and operators must collect and remit state and local lodging taxes.
Neighborhoods with the highest yields tend to have the tightest supply, so move quickly if you find a property that fits your underwriting. Winter and spring are the revenue engines here, look for homes that can capture peak occupancy in February and March. Finally, work with a local agent who knows the nuances of Fort Lauderdale’s evolving rules and can help you navigate permitting and compliance. Connect with a Fort Lauderdale short-term rental agent to get started on your search.