


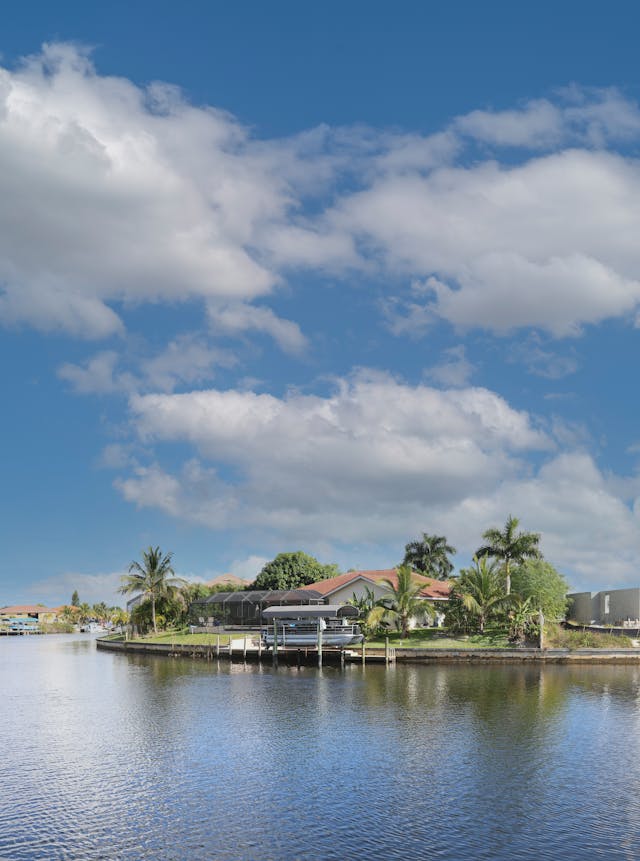
According to Chalet Data, Cape Coral’s short-term rental market stands out for its high yields and pronounced seasonality. The city’s top neighborhoods cluster along the waterfront and in newer, fast-growing areas, with gross yields ranging from 8% to 9% and median home values spanning $326,500 to $397,800. Cape Coral’s 11.2% citywide yield lands it in the 71st percentile nationally, even as occupancy has softened 41% year-over-year and home values have dropped 10.7%.
The city’s annual revenue per listing still averages $37,993, thanks to strong winter and spring demand and an ADR that outpaces the US median. Investors weighing Cape Coral should focus on neighborhoods with resilient booking patterns and consider the city’s sharp swings between peak and off-season. Explore the best neighborhoods below, and
Cape Coral Short-Term Rental Market at a Glance
- Median gross yield: 11.2%
- Annual revenue (headline): $37,993
- Active-operator annual revenue: $37,278
- Median occupancy: 32%
- Average daily rate (ADR): $266
- Median home value: $338,328 (YoY: -10.7%)
- Active full-time listings: 2,992
- US gross-yield rank: #136 of 501
- Data period is July 2025 – June 2026
The Best Cape Coral Neighborhoods for Airbnb, Ranked by Yield
| Rank | Neighborhood | Gross Yield | Annual Revenue | Median Home Value | ADR | Occupancy | Active Listings |
|---|---|---|---|---|---|---|---|
| 1 | 33904 (Yacht Club & Downtown) | 9% | $33,969 | $379,100 | $282 | 33% | 608 |
| 2 | 33993 (Northwest Cape Coral) | 9% | $31,864 | $364,200 | $265 | 33% | 774 |
| 3 | 33909 (Northeast Cape Coral) | 9% | $27,950 | $326,500 | $238 | 32% | 478 |
| 4 | 33990 (Mid-Cape Coral) | 8% | $29,309 | $359,700 | $255 | 32% | 651 |
| 5 | 33991 (Southwest Cape Coral) | 8% | $31,933 | $397,800 | $277 | 32% | 481 |
Data as of July 11, 2026. Annual revenue is calculated for each listing as ADR × occupancy × 365, using trailing 12-month data, and is gross before expenses. Table values reflect the median for each metric. Multiplying ADR by occupancy will not reproduce the revenue figure, as each is an independent median.
Gross yield divides the median revenue by the median home value (Zillow Home Value Index). See our full methodology. The active-operator revenue benchmark filters to listings with consistent booking activity, which is the figure buyers should underwrite against.
1. 33904 (Yacht Club & Downtown): Classic Waterfront Demand
33904 stands out for its blend of historic canalfront homes and proximity to Cape Coral’s Yacht Club, marinas, and downtown amenities. The area’s 9% gross yield is powered by a median annual revenue of $33,969, with home values at $379,100. Seasonality is pronounced here. Occupancy surges to 69% in March, while September drops to just 15%. Winter alone accounts for 36% of annual revenue, making timing critical for operators.
This neighborhood’s ADR sits at $282, well above the US median, and occupancy matches the city’s 33% average. The payback period is about 11.2 years at the active-operator benchmark, which runs $33,278, slightly below the citywide figure. The area’s property mix leans heavily toward three-bedroom canal homes, appealing to families and groups seeking waterfront access and quick routes to the Gulf.
Investors should note that demand is highly concentrated in the winter and early spring, so cash flow can swing sharply with the seasons. The 33904 analytics page details the month-by-month revenue curve and property mix for deeper underwriting.
| Gross yield | 9% |
| Annual revenue | $33,969 |
| Active-operator revenue | $33,278 |
| Occupancy | 33% |
| ADR | $282 |
| Median home value | $379,100 (YoY: -10.7%) |
| Full-time listings | 608 |
Who this market is ideal for: Buyers seeking classic Cape Coral canal homes with high winter upside and proven guest demand.
2. 33993 (Northwest Cape Coral): Room to Grow in Newer Developments
Northwest Cape Coral (33993) offers a landscape of newer homes and larger lots, with a 9% gross yield and median annual revenue of $31,864. Home values here run $364,200, and the area’s 33% occupancy matches the city average. March is the make-or-break month, with occupancy peaking at 67% and ADR hitting $272, while September drops to 16% occupancy.
Revenue is highly seasonal, with winter and spring combining for 60% of the year’s total. The active-operator benchmark comes in at $32,100, and the payback period is just over 11 years. The property mix leans toward modern three- and four-bedroom homes, attracting families and snowbird groups looking for more space and quiet surroundings.
33993’s appeal is its growth potential. As new construction continues, buyers can find properties with lower maintenance needs and upside as the area matures. The analytics dashboard for 33993 breaks down the latest trends in occupancy and rate growth.
| Gross yield | 9% |
| Annual revenue | $31,864 |
| Active-operator revenue | $32,100 |
| Occupancy | 33% |
| ADR | $265 |
| Median home value | $364,200 (YoY: -10.7%) |
| Full-time listings | 774 |
Who this market is ideal for: Investors focused on newer builds, larger homes, and long-term growth in a fast-developing part of the city.
3. 33909 (Northeast Cape Coral): Entry-Level Pricing, Steady Returns
33909 is the most affordable of Cape Coral’s top neighborhoods, with a median home value of $326,500 and a 9% gross yield. Annual revenue for the median listing is $27,950, and occupancy holds at 32%. March is again the high point, with occupancy at 65% and ADR at $230, while September falls to 15% occupancy.
Seasonality is strong, but the lower entry price means a payback period of about 10.5 years at the active-operator benchmark ($27,400). The area’s property mix includes many three-bedroom homes in quiet residential enclaves, drawing budget-conscious families and longer-stay guests. ADR here is $238, below the city average but still above the US median.
For buyers seeking a lower-cost entry into Cape Coral, 33909 offers stable returns and less competition from luxury inventory. The 33909 analytics page has a detailed breakdown of seasonal revenue and property types.
| Gross yield | 9% |
| Annual revenue | $27,950 |
| Active-operator revenue | $27,400 |
| Occupancy | 32% |
| ADR | $238 |
| Median home value | $326,500 (YoY: -10.7%) |
| Full-time listings | 478 |
Who this market is ideal for: Value-oriented investors targeting entry-level homes and steady, year-round demand.
4. 33990 (Mid-Cape Coral): Central Access and Stable Demand
Mid-Cape Coral (33990) balances central convenience with solid returns. The gross yield is 8%, with annual revenue at $29,309 and home values averaging $359,700. Occupancy is 32%, peaking at 66% in March and dipping to 15% in September. Winter bookings account for 34% of annual revenue, giving this area a slightly more balanced seasonal curve than the city’s waterfront zones.
The active-operator benchmark is $28,900, translating to a payback period of about 12.5 years. The area features a mix of three- and four-bedroom homes, appealing to travelers who want easy access to shopping, dining, and both the northern and southern ends of the city. ADR is $255, just below the city average.
33990’s centrality draws a steady stream of guests, and its property mix allows for flexible pricing strategies. For a closer look at the month-to-month performance, check the 33990 analytics dashboard.
| Gross yield | 8% |
| Annual revenue | $29,309 |
| Active-operator revenue | $28,900 |
| Occupancy | 32% |
| ADR | $255 |
| Median home value | $359,700 (YoY: -10.7%) |
| Full-time listings | 651 |
Who this market is ideal for: Buyers who want central access and a balanced guest mix, with less volatility than pure waterfront plays.
5. 33991 (Southwest Cape Coral): High-End Homes and Premium Rates
Southwest Cape Coral (33991) is the highest-priced neighborhood on this list, with a median home value of $397,800. It delivers an 8% gross yield and annual revenue of $31,933. Occupancy is 32%, peaking at 68% in March and dropping to 16% in September. ADR is a robust $277, reflecting the area’s upscale inventory and strong winter demand.
Winter and spring together generate 62% of annual revenue, so cash flow is highly seasonal. The active-operator benchmark is $31,200, with a payback period of roughly 12.8 years. The property mix features larger, high-end homes with pools and golf course access, catering to affluent families and groups seeking a premium experience.
33991’s high home values require careful underwriting, but the area’s reputation and amenities support above-average rates. For more details on performance and property mix, see the 33991 analytics page.
| Gross yield | 8% |
| Annual revenue | $31,933 |
| Active-operator revenue | $31,200 |
| Occupancy | 32% |
| ADR | $277 |
| Median home value | $397,800 (YoY: -10.7%) |
| Full-time listings | 481 |
Who this market is ideal for: Investors seeking premium nightly rates and larger homes, with the capital to weather off-season swings.
How to read these rankings before you buy
Gross yield is a starting point for comparing neighborhoods, but it does not reflect all the costs or risks of operating a short-term rental. The headline revenue figure averages all listings, while the active-operator benchmark filters for properties with consistent bookings, this is the number buyers should use for underwriting.
Seasonality in Cape Coral is sharp, so annualized numbers may mask cash flow swings between winter peaks and slow summer months. Always verify property-level details, including location, amenities, and HOA rules, before committing to a purchase.
How to Act on This
Buying a short-term rental in Cape Coral requires careful attention to both the city’s pronounced seasonality and its evolving regulatory landscape. All short-term rentals must be registered with the city under Ordinance No. 24-21, with a $350 annual fee and compliance required for rentals of six months or less. Operators must also collect and remit Lee County tourist development tax and state lodging tax. HOA rules can further restrict rental activity, so review neighborhood covenants before making an offer.
Investors should focus on properties with features that drive winter demand, such as pool access, waterfront location, and proximity to marinas or golf courses. Underwrite using the active-operator revenue benchmark, and plan for cash flow dips in the summer and fall. With home values down more than 10% year-over-year, entry points are more attractive, but verify current rules and tax obligations before closing. For tailored guidance and access to on-the-ground insights, connect with a Cape Coral short-term rental expert today.